
The Broncos, Eagles, 49ers, Bengals, and Patriots, respectively, are tolerating the fewest total FPG to opposing offenses this season. Of the 11 matchups on the main slate, we have to deal with four of those defenses. Then we have the Jets. A very strong argument can be made in favor of the Mean Green as the top defense in the NFL. Their nasty pass rush and perimeter corners are, at the very least, among the top two across the league. However, the removal of Breece Hall leaves New York as one of the bottom-two offenses mucking up television screens across the world.
Every team (eight total) in the AFC East and NFC East carries no lower than a .500 record into Week 11. Among the 24 other teams, only 10 can stake the same claim. There are as many teams with at least six wins in those East divisions as there are in the other six divisions combined. The main slate will be without 40% of the teams with six-or-more wins. The asset we can always count on with every main slate is the Milly Maker and its grand prize. For those that missed the notice last week, Advanced Matchups is now entirely crafted toward taking down that specific contest. Locate your spectacles and favorite reading chair, we’ll kick this off with a look at the winning lineups from the first 10 weeks.
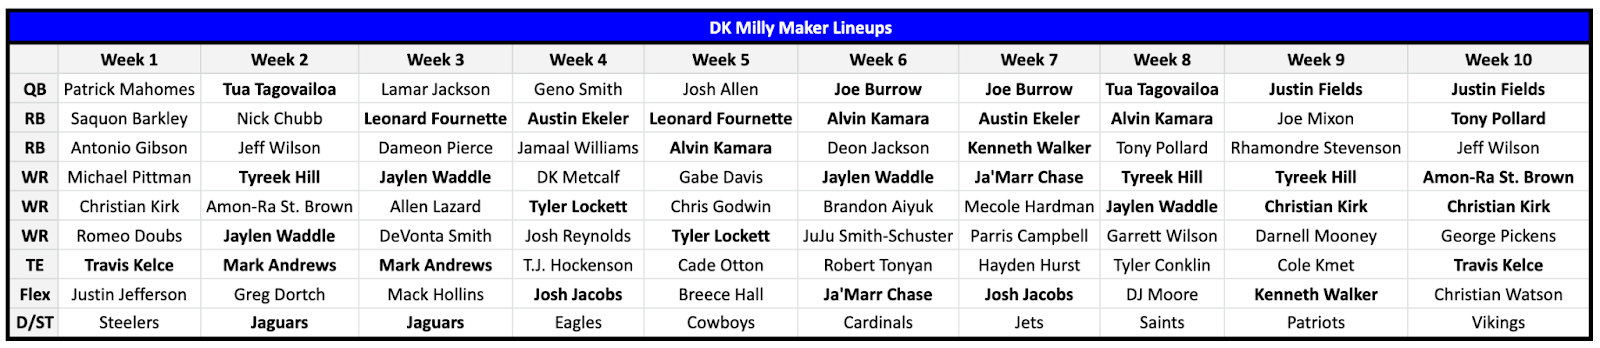
The bolded names are the players appearing on a winning line at least twice. With back-to-back QB1 performances, Justin Fields joins the duo of repeat performers at QB to pop twice: Tua Tagovailoa and Joe Burrow. Alvin Kamara is still the only RB to capture the Milly three times. Tony Pollard joins previous two-timers Austin Ekeler, Josh Jacobs, Kenneth Walker and Leonard Fournette.
Jaylen Waddle is still comfortably leading all positions with four Milly inclusions, followed by his teammate Tyreek Hill with three. Amon-Ra St. Brown and Christian Kirk enabled the Week 10 winner, joining Ja’Marr Chase and Tyler Lockett as wideouts landing in lineups twice. The only factors preventing St. Brown from populating the repeat-offender list much earlier were an ankle injury and concussion. Mark Andrews finally has some company among TEs with two pops after Travis Kelce was rostered in Week 10, nine weeks after his first appearance way back in Week 1.
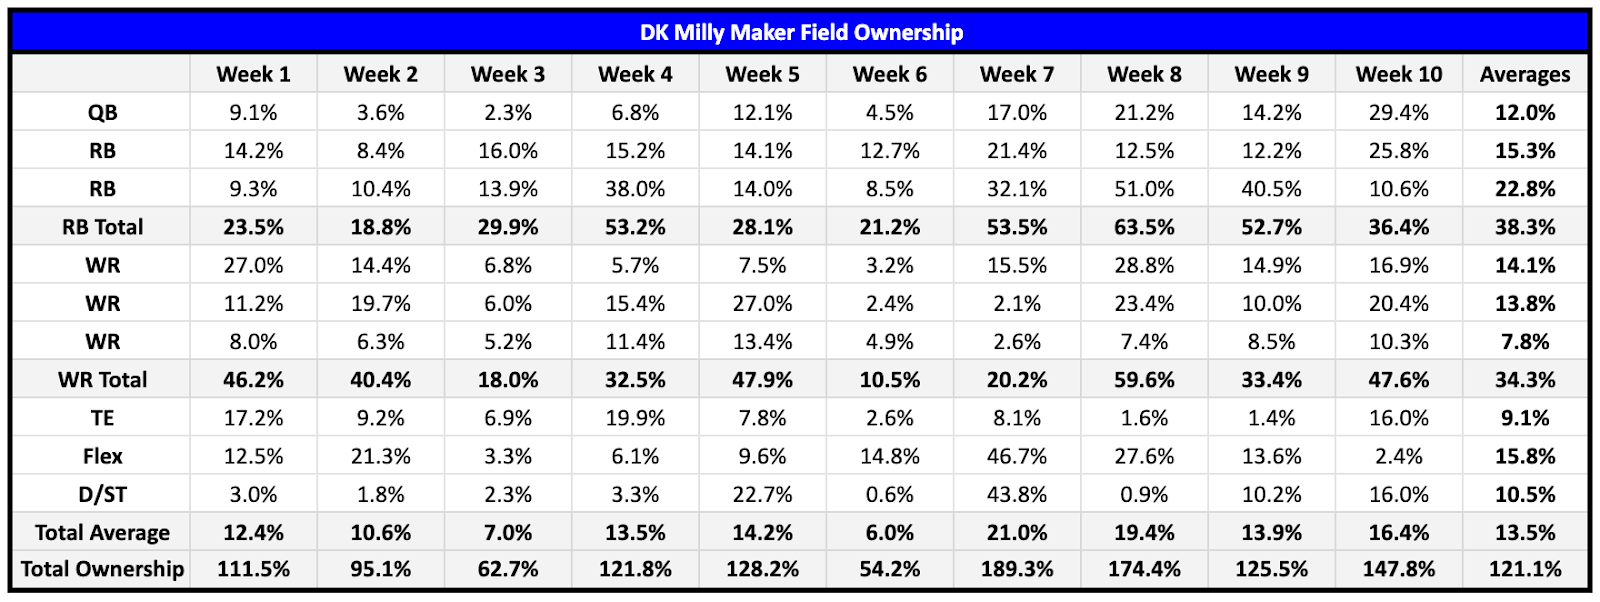
Each of the players from the previous graphic are replaced with their field ownership in the table above. The average ownership among the nine slots jumped another 0.3% up to 13.5%. If you invest in the Milly Maker, get all of those contrarian devotions out of your brain. Yes, two (20%) of the 10 winners accomplished the feat with the minuscule numbers that fuel the motivations of united contrarians across the globe. Those two lines had a combined total ownership less than six of the other eight. However, the success of those lines required far more than a knowledge of the underowned projections. Out-of-nowhere upsets and previous underperformers led the way.
The focus should always center around maximizing FPs. We’ve seen four straight winners take home the top prize with an average ownership of 13+%. For the obstinate individuals who simply must get their contrarian fix, focus that addiction to the WR3 – lowest-priced WR selection, TE and D/ST slots. The selected QBs began the year with four-straight selections under 10% – 5.45% average – and in five of the first six. However, we were provided with the highest field ownership of the season at QB last week from Fields (29.4%). Do not discount the reality of those low early numbers at QB as being due to the field evaluating which QBs were worthy of their investments. It’s clear from the last four weeks that the room for error with with our QB selections has evaporated.
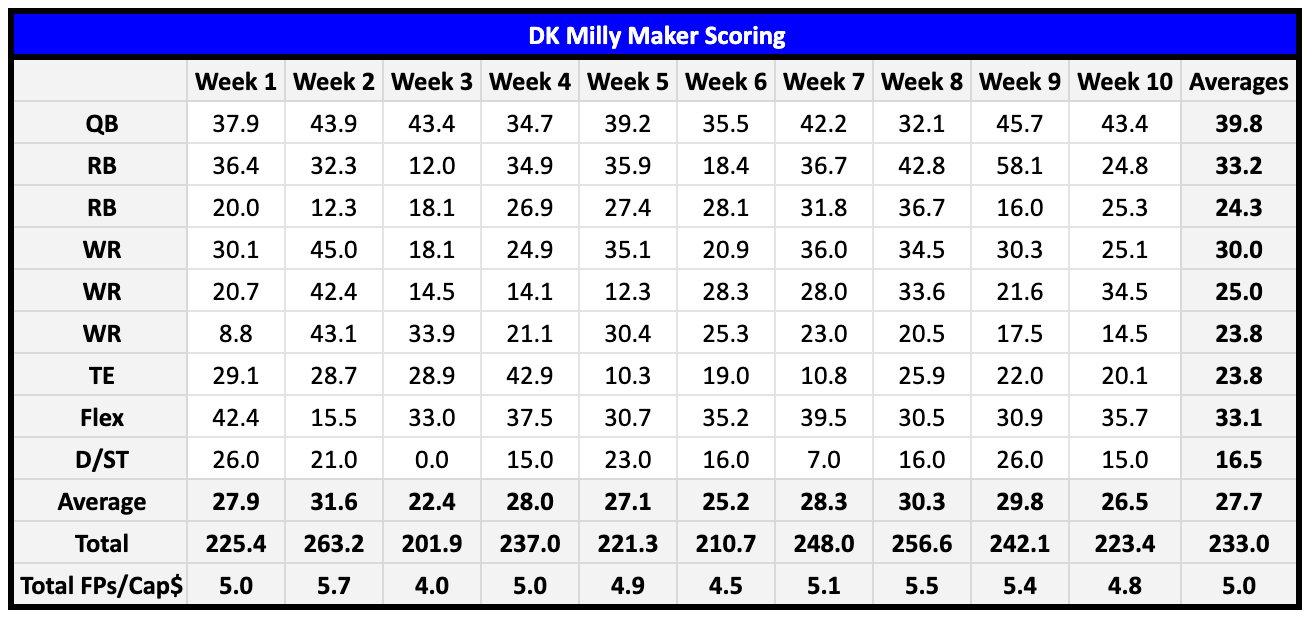
The table above detailing the individual scoring is one of the most straightforward graphics provided. Jumping back to the anti-contrarian argument, check out the Total FPs/Cap$ line at the bottom. Those 4.0 and 4.5 numbers from Weeks 3 and 6 coincide with those contrarian-minded victors. They are easily the lowest averages on the list. The key takeaway from the two is that, in order for those successes to have been possible, they must be paired with the chalk and universal projections crashing well below expectations. Don’t forget that the list of DFS degenerates of the world is not limited to the individuals you run across in general fantasy leagues. In addition to our math-based poker/casino brethren, career mathematicians are also in the mix. Wagering chunks of our bankroll against the calculation trends may not be the best investment strategy.
The crystalline takeaway continues to be found in the unadulterated importance of nailing our QB, RB1, WR1 and Flex selections – the Big 4 – with big FPG returns. We need 136.1 total FPs and an average of 34.0 from those four spots alone if we want to compete. At the same time, locking down top performers at each of those four spots – which is not a tall order when the process is sound – opens up considerable breathing room to focus on value/dollar invested at RB2, WR2, WR3 and TE. Let’s shift attention to the table below, listing the salary cap expenditure distributions for the winning lineups.
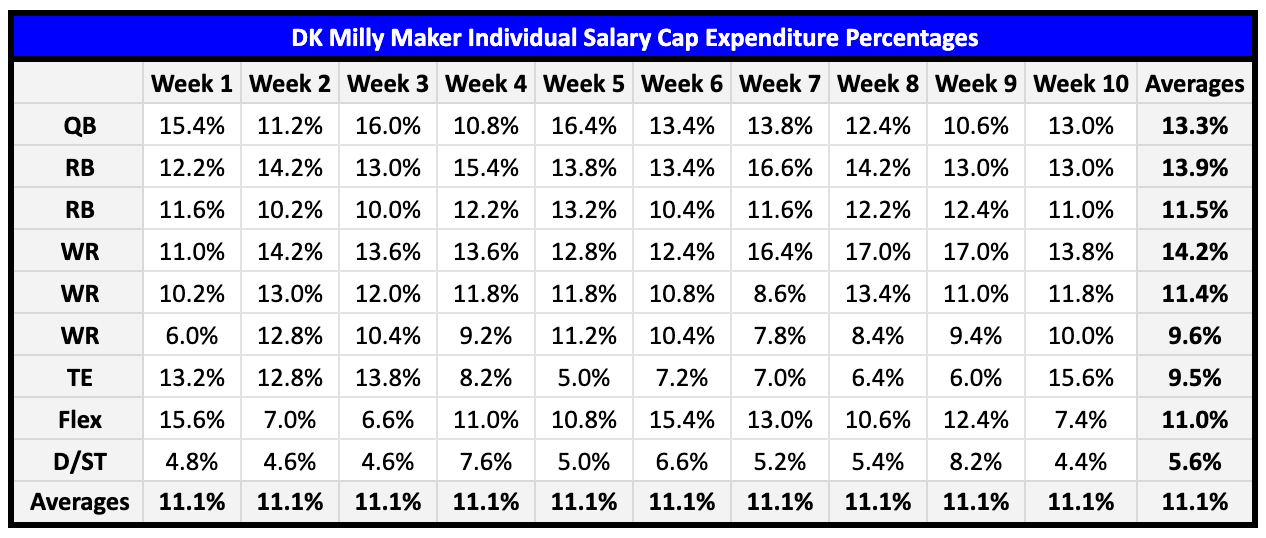
Players priced at $8K-or-higher have still only been selected to winning lineups six times. And the one line that rostered two inside their cap allowance continues to be the only example. The total now stands at five lines that were entirely assembled without $8K-or-higher players. The distribution of those $8Kers are as follows: two QBs, one RB and three WRs. Oddly enough, Travis Kelce (W1) and Mark Andrews (W2 and W3) were priced under $7K when they landed on winning lines. That leaves Kelce’s $7.8K salary from last week as the only TE example priced above $7K.
Christian Watson ($3.7K) bucked the trend from the previous six-straight weeks where at least 10% of the winning cap was devoted to the Flex slot. Just remember that we were given 35.7 reasons why that selection had to hit big or the line would have faltered. I personally entered the late matchups with well over $15K in winnings. I still hit 3.75 times my entry fees, but that total dropped by 90% singularly due to Watson’s performance. Allow me to reiterate for anyone skimming the information: above all else, our QB, RB1, WR1, and Flex investments must hit to compete for the Milly.
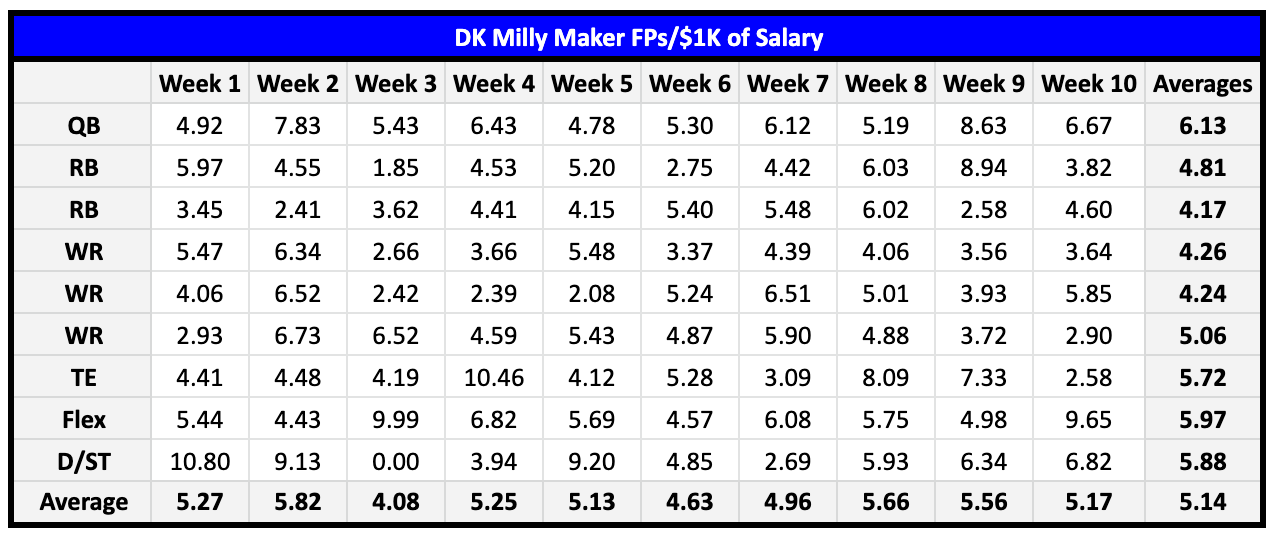
A variation to the Total FPs/Cap$ numbers from the earlier player scoring graphic, the table above of the FPs/$1K of Salary above provides the individual multipliers, weekly averages from the combined total of positional averages, and the averages multipliers for each individual position. I know… we have so many averages to factor in each week. It can be overwhelming unless you train your brain to find comfort in the averages. Keep in mind that I do not have the data on how many entries each of the winners entered from all 10 weeks. What I do know is that, unless you are banking on only one-or-three lines, we should not be putting every ounce of our soul into every entry in the Milly. The process is devoted to playing the averages.
Speaking of averages, the data from this table identifies a key factor to success: slaying at every slot is obviously ideal, but the FP/$1K of pricing potential at TE and D/ST are not that far off from the potential at QB and Flex. The winning Week 10 line appears, on the surface, to have gone off the rails from my belief that we should devote around the same salary at QB that we do at TE and D/ST, combined. However, check the returns (2.58x) from Zeus’ ($7.8K) pricing. Kelce fell 14.1% short of his pricing floor. The winning line is a far cry from the optimal line. Cole Kmet ($3.4K) would have been the far superior investment with 23.4 returns (6.88X). And Kmet paired with the Vikings’ D/ST would combine for $900 less than the line’s QB. Scoring enough points at any slot can obviously result in capturing the top prize. These are general guidelines estimated from the averages, not set-in-stone rules.
The W10 line bolstered the view – now supported by 90% of the winning lineups – of investing at least $6.5K or 13% of the cap at RB1. Saquon Barkley ($6.1K) is the only outlier this season, back in Week 1. JuJu Smith-Schuster provided the perfect evidence last week against going all in on one individual. An outstanding QB, an outstanding matchup on paper and returns of an early concussion eliminating all lines from contention. Trust in the process. Play the matchups. Play the averages. Build process player variants into your build selections.
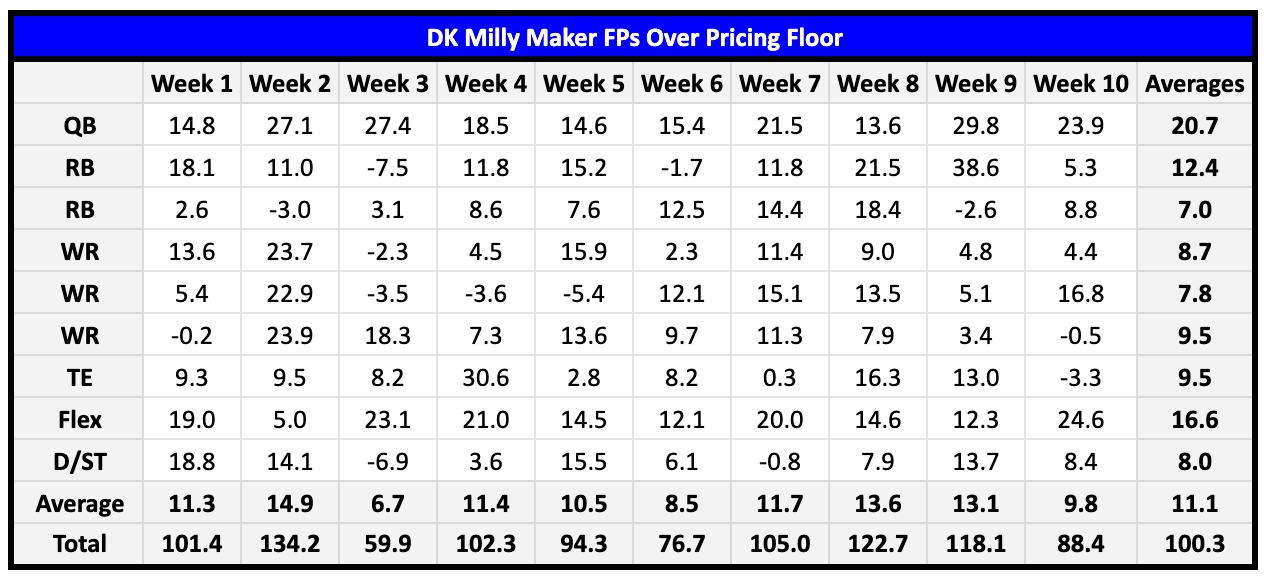
Looking at the table below, all 10 of the winning lines were populated by QBs landing at least double-digit profit levels. A massive 70% of those QBs returned 15+, while 50% have hit the 20+ paydirt to push the overall average to 20.7. Pay particular notice to the 100.3 average at the very bottom-right We need 100.3 FPs above the floor baseline of 150.0 FPs to have a shot at the Milly. This data spotlights the decision in choosing the QB1 on the slate as superseding all others. That decision is followed in importance by those at Flex, then RB1, and, surprisingly enough, WR3 and TE. This data on our selections at WR3 – lowest-priced wideout – and TE is not informing us that these slots need the highest FP returns. It is telling us that the value potential at those spots is key. Belaboring the message from last week, this profitable returns study hammers away on the fact that our choice at Flex is not one that should end in tossing a blind dart pulled out of the dark. We need serious profit from that Flex selection that is only supplanted by the requirements at QB.
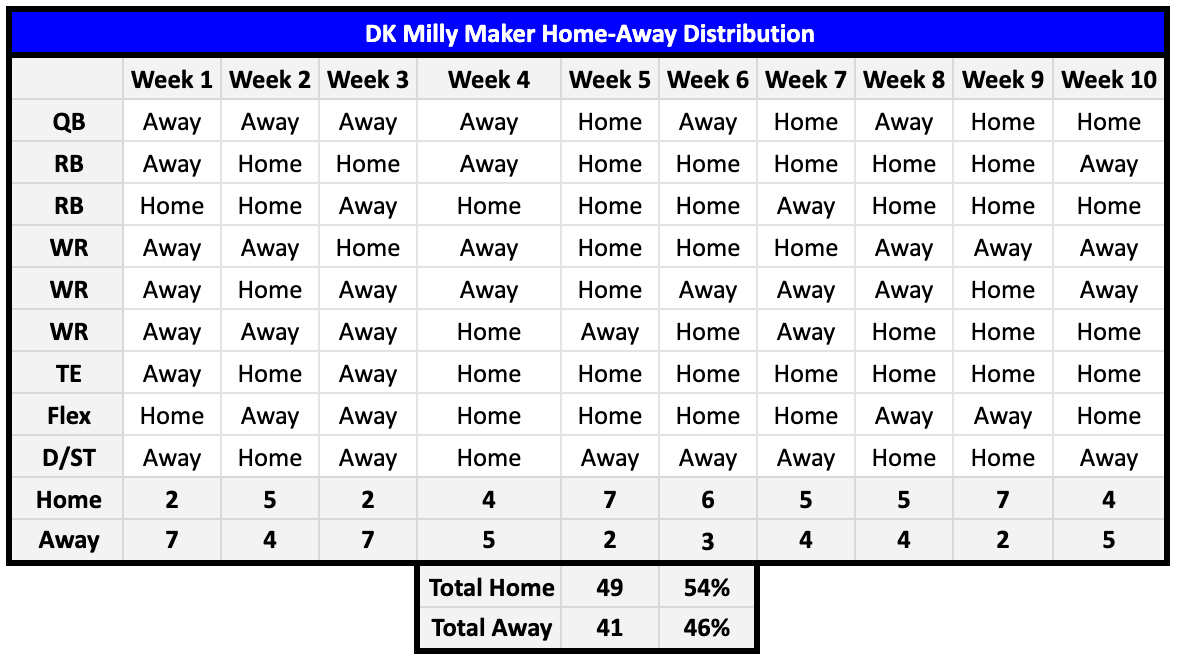
Does the Home-Away distribution from the winning lineup graphic that you can find below offer incredible insight? Maybe, kinda, sorta. In short, the data is all over the place at some slots, while offering intriguing enlightenment at others. One pattern of note is that 77.3% of the RB selections this season – including those at Flex – played on their home fields. Another takeaway seems to completely debunk the belief that we should focus our attention on exposure to D/ST home games. Six of the 10 winning lines had an away D/ST selected. At TE, 80% have played at home; the position has built a streak that has now extended to seven-straight weeks. The results at QB, WR, and overall are completely irrelevant.
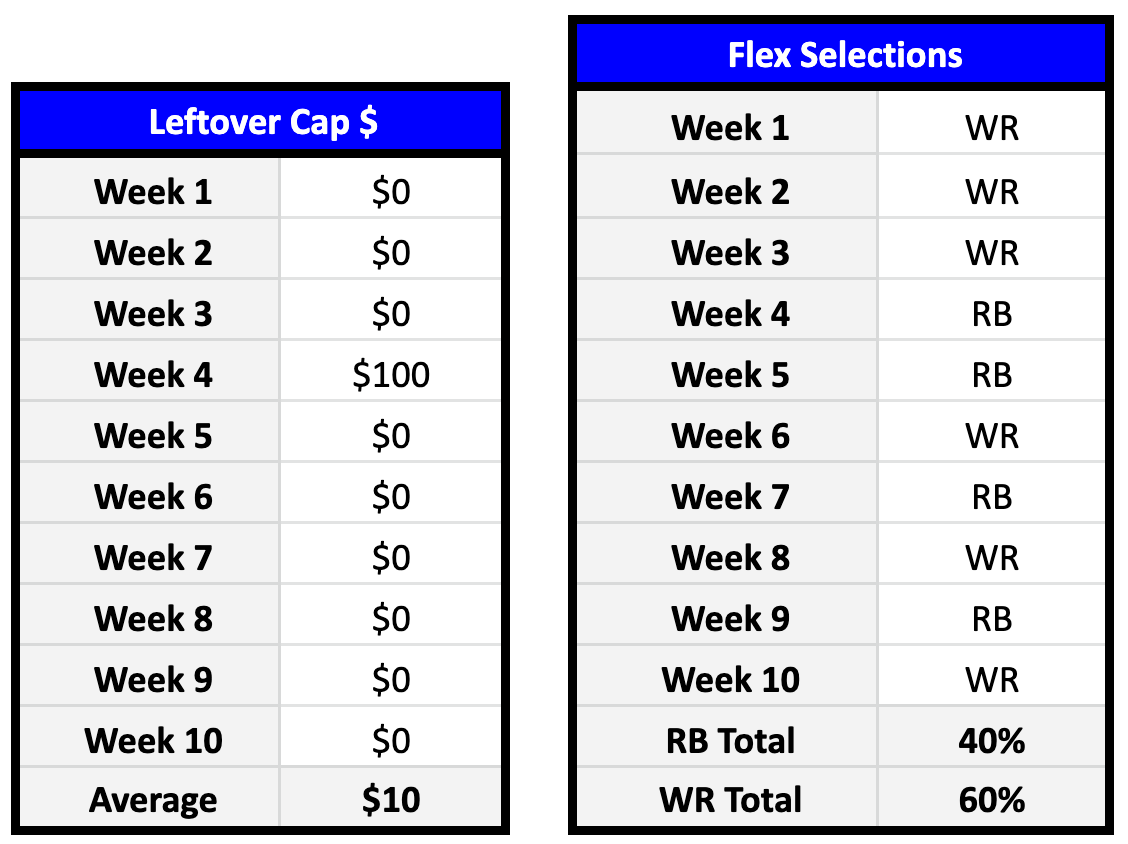
Before anyone tries to get cute by leaving cap dollars on the table, check the table on the left below first. A whopping $100 of the combined $500,000 cap dollars went untouched by the ten Milly winners. I was rather surprised to see that 40% of the lines were successful with a RB at Flex. Just keep in mind that those four RB selections returned an average of 34.7 FPG.
The Stack table below requires some setup. We’ll use the entry on the Week 2 line. The QB-TE stack is straightforward as a QB and TE correlation from the same team. The next entry presented is a WR from the away team (A), tailed by the RB from the home team (H). The rest is self-explanatory.
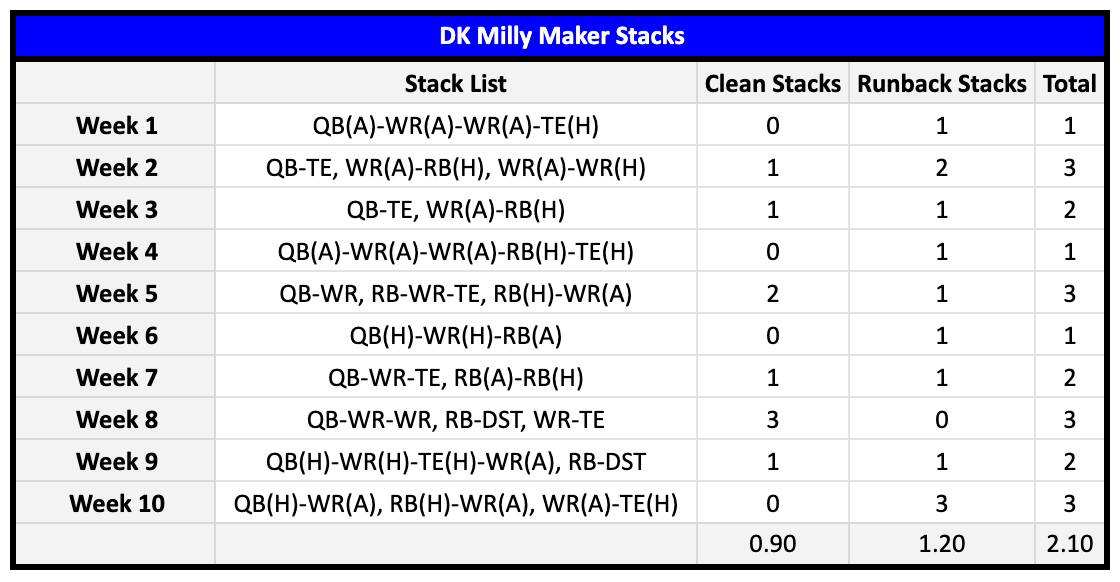
The takeaways are as follows:
The most obvious: all 10 lines featured at least one stack.
After the QB selections the first nine weeks correlated with at least one receiver teammate, the W10 victor rostered Fields without any of his receivers. However, Fields was stacked with ARSB from the opposing sideline.
Four of the 10 QBs were only stacked with one receiver.
Five of the lines have been assembled with two receivers attached to their QB (50%).
Runbacks to the selected QB have now graced 40% of the lines; only fitting one week after suggesting we resist obligatory urges to include them as an entry staple.
Many cherish their attachments to RB and DST correlations, yet we still only have two of the lines (20%) featuring that strategy.
The final suggestion is, once again, to mix-and-match stack configurations, in place of any set configuration.

How does all of this Milly Maker analysis tie in to Advanced Matchups? Nothing has changed from last week: the table above should provide all the proof required to solidify the viability of digging deep into the matchups each week to iron out our passing-game options. A total of 30 of the 56 exposures (54%) at QB, WR, and TE from the 10 lines took advantage of the Cover 1 offerings distributed by opposing defenses that week. A further 19 individuals (34%) found their success across from Cover 3. As a reminder, Cover 1 and 3 combine for 55% of the total average of the defensive shells offenses have faced through 10 weeks. While the 13 players (23%) that found at least half of their success across from the split-safety setups of Cover 2 and 4 are a bit trickier to identify, we still had those scheme tendency percentages in-hand in advance.
We still only have two WR outliers evading the coverage success approach between Mecole Hardman (long rushing TD in Week 6) and Greg Dortch (TD reception in a goal-to-go in Week 6). The total stands at three Milly-winning TEs completing almost the entirety of their work facing goal line-specific schemes. That trio solidifies the unreliability of focusing entirely on the defensive scheme setup. We should always focus the majority of our TE selection sequence toward identifying the vulnerable team matchups to TE production. It definitely doesn’t hurt to scan the history of scheme success, but general defensive FPG susceptibility is the most consistent green arrow pointing toward inline and/or Joker production.
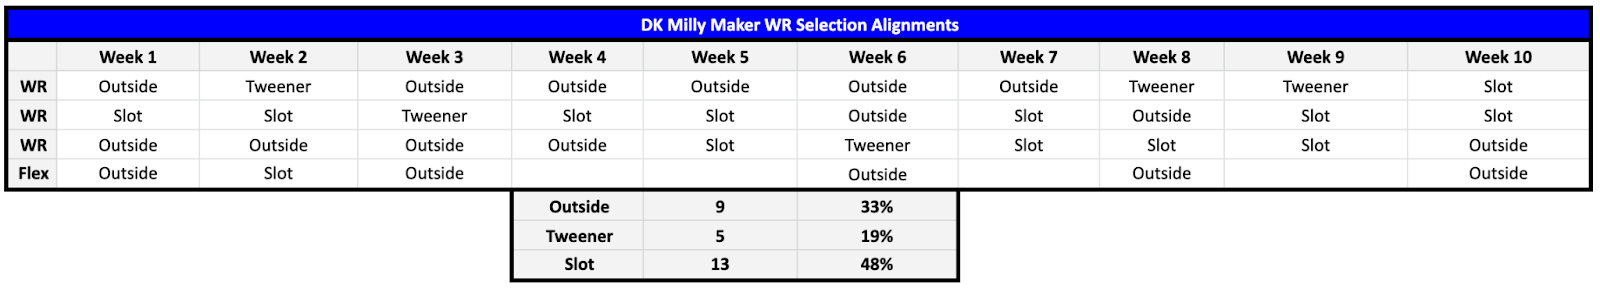
As you can see in the table above, Slot receivers, on average, continue to dominate the victorious Milly setup. Keep in mind that the number of outside receivers gracing the lines (18) has been cut in half to nine in order to account for each team starting two receivers on the perimeter. In turn, the total WR selections must be dropped from 36 to 27 – the number used as the denominator. If we keep that number at the original 18, 50% of the selections have been from the outside.
Some offenses will utilize more than one WR from the slot, but we see most outside wideouts work on the inside and vice versa. The point of the exercise is to identify the general WR roles populating lineups; it’s not exhaustive research on the multitude of roles and alignments in each receiver’s repertoire. If a WR has played a higher percentage on the outside, they are classified as an Outside WR. If a WR has played a higher percentage on the inside, they are classified as a Slot WR. If that number is within three percentage points of 50%, they are classified as a Tweener.
Anyone living above the 37th parallel north, or 37° north of the Earth's equator is already well aware of the brutal cold currently sweeping across the USA. NFL play has been very fortunate to sidestep the winter conditions that have plagued the college game in recent weeks. I’ve personally taken an overall loss in bankroll over that stretch directly related to the weather stunting offensive production. That’s headlined by the Ohio State-Northwestern game recently being played in 50 MPH winds – not a typo. The table below was constructed to aid us in avoiding the conditions that most significantly impact offensive output.
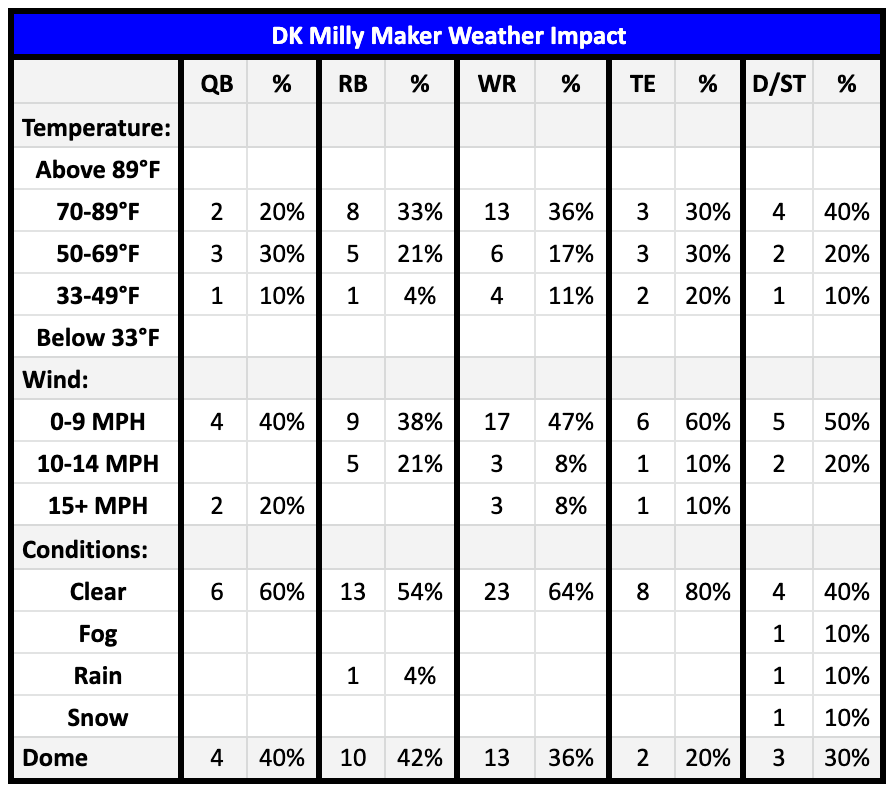
QBs and RBs from the winning lines, sans the one example from each, have avoided temperatures between 33-49°F. The fact that four WRs were found on lines that hit is all we need to know that range is not a significant concern. We definitely want to keep an out for D/ST units entering into matchups with poor weather conditions. A good number of the field will also tail the weather forecasts, but we will gain an advantage over those that do not. Oddly enough, only one D/ST has played with a temp under 49°F and none with winds of 15+ MPH. We have zero data on the viability of attacking the Milly with individuals playing with the temperature gauge below 33°F or above 89°F.
We only had a single game played with 15+ MPH winds through Week 4 (Steelers at Browns in W3). We got our second example in Week 5 (Steelers at Bills), an opportunity Gabe Davis used to put 3-171-2 and 35.1 FPs on Pittsburgh while adorning the winning line. Each of the other three receiver examples to land within those windy conditions were provided from the Miami at Chicago clash in Week 9: Tyreek Hill, Darnell Mooney and Cole Kmet. Josh Allen paired with Davis on that W5 line, while Fields was attached with his two receiver teammates.
The two details from the graphic that must be pointed out are as follows:
All 10 of the QBs, all 36 of the WRs, and all 10 of the TEs – 56 out of 56 examples – either played under a dome, or with Clear Conditions.
30% of the winning D/ST’s played with either Fog, Rain, or Snow officially categorized by the weather service.
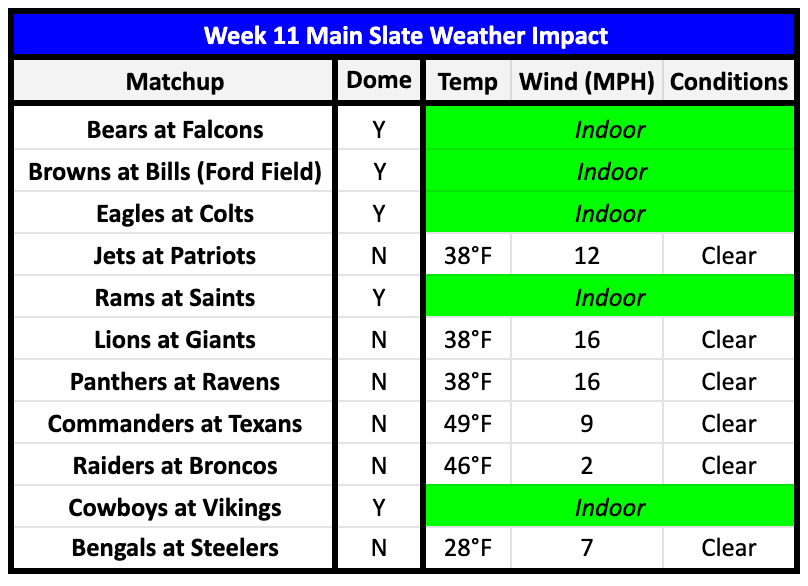
You can find the weather forecasts for Week 11 portrayed in the table above. The only game that did bring along concerning weather conditions on the main slate was the Browns at Bills matchup. With that game relocated under the Lions’ dome at Ford Field, the entire slate will, once again, sidestep all concerning weather conditions.

You’ll begin to see a trend as we work through the remaining tables. Every scenario or factor that I’ve been able to process as impacting the Milly Maker is examined in full. The one above works through the potential impact of Game Script. The entries in italics indicate a close decision on the selection. Perhaps the narrative persists for some that we only want to choose RBs anticipated to enter matchups with positive scripts. For others, it’s that we want to go after passing-game options considered significant underdogs that will be forced to air it out early. The data suggests that we should toss both of those ideas out of the process.
In my view, any average below 60% is statistically insignificant. Stick one example into one of the categories with a lower percentage and the numbers equalize. Looking purely at the skill positions, the total script numbers sit at 53% positive, 47% negative. Is anyone shocked to see eight of the D/STs benefiting from a positive script? The 20% that landed from a negative script is the real surprise.
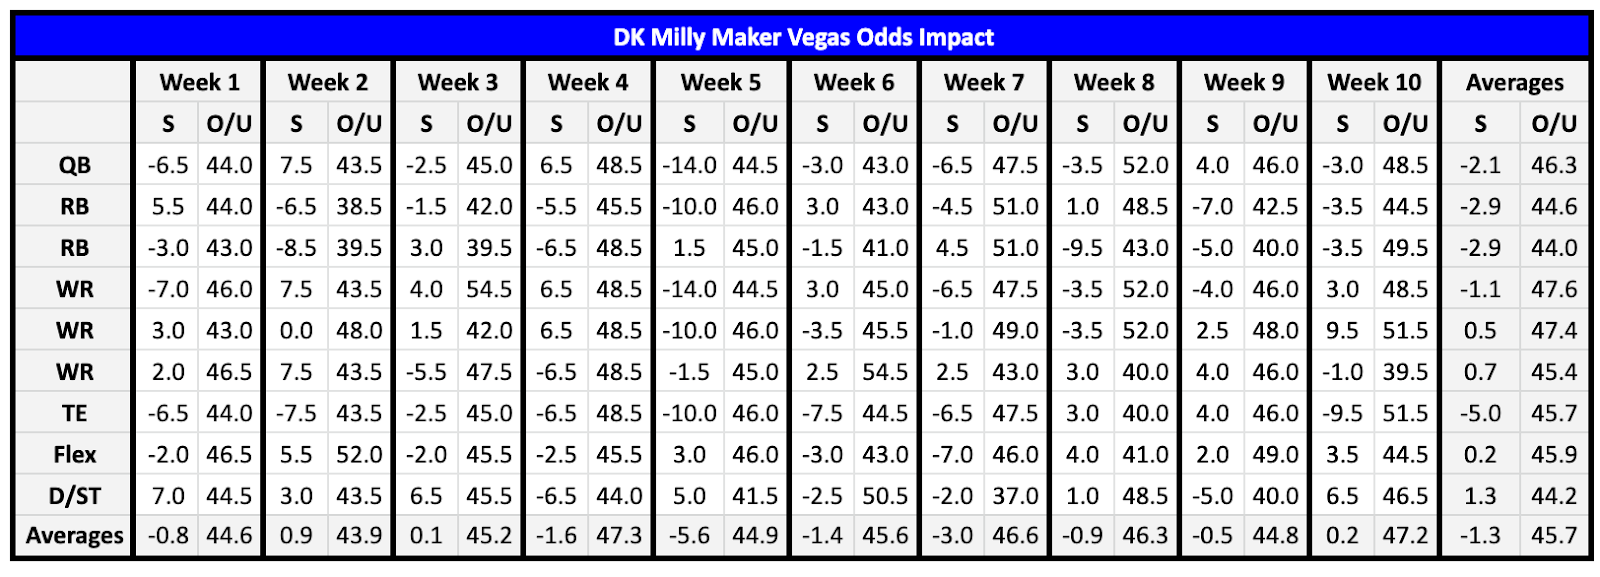
The DFS world revolves around the seemingly arbitrary numbers attached by Vegas oddsmakers that are altered by the money over the remainder of the week. The information in the table above places the final lines under the spotlight. An average -2.9 spread at both RB positions is absolutely actionable. Following Saquon Barkley and the Giants at +5.5 in Week 1, no other Milly RB played with a +5.0-or-more spread and only one (Kenneth Walker with +4.5 in Week 7) did so with a spread higher than +3.0. It’s compelling food for thought on our RB selection process, but that fails to hold a candle to the average -5.0 spread at TE. Weeks 8 and 9 (Tyler Conklin and Cole Kmet, respectively) are the only examples from teams with a positive spread. The average -1.1 spread at WR1 is interesting in that both of the other WR slots average at least +0.5 in the other direction. The average spread of -2.1 QB is right where we would expect since they have such a drastic impact on the construction of those spreads.
Does it stand out to anyone that we only saw a single over/under (O/U) entry of 50-or-more through the first five weeks? In fact, only 10 examples of 50-or-more O/U entries have landed on a winning line through 10 weeks. Dipping our toe into the 50-plus implicated matchups is definitely viable, just avoid going overboard. As far as the individual O/U averages, it appears the strategy of selecting RBs from the matchups with lower implied totals has legs. Combining that with the spread averages, it appears we can further narrow that focus down to teams implied as favorites. It’s the opposite at D/ST. Lower O/U, implied underdog averages. As expected, the average O/U at QB, WR1, and WR2 lead the way. The average totals at WR3, TE and, the most eye-opening, at Flex appear to allow for more freedom with the total implied scoring projections.
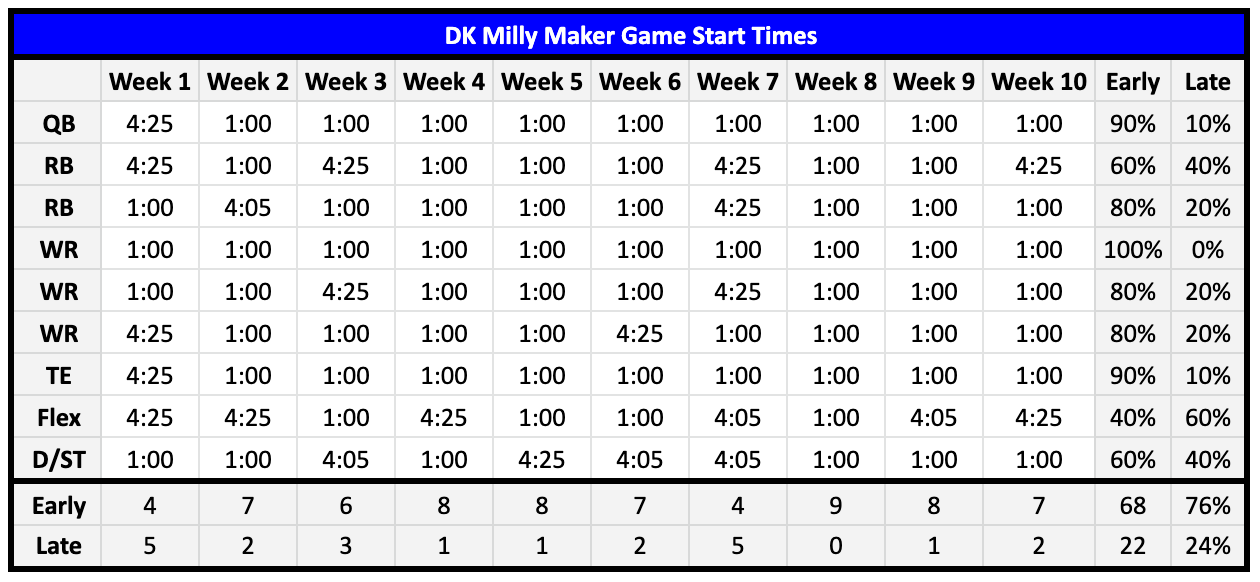
Game start times, really? It’s worth a look. Consider that all 10 of the winning WR1s have been from the early (1:00 PM Eastern) slate – 24% over expectations based on the total early and late (4:05 and 4:25) matchups. On the flip side, Flex selections have been 47% over expected from the late slate. RB1 and D/ST choices have both been 21% over expected from the late slate. While QBs and TEs have been chosen 16% over the expected from the early slate. Use that information as you like.
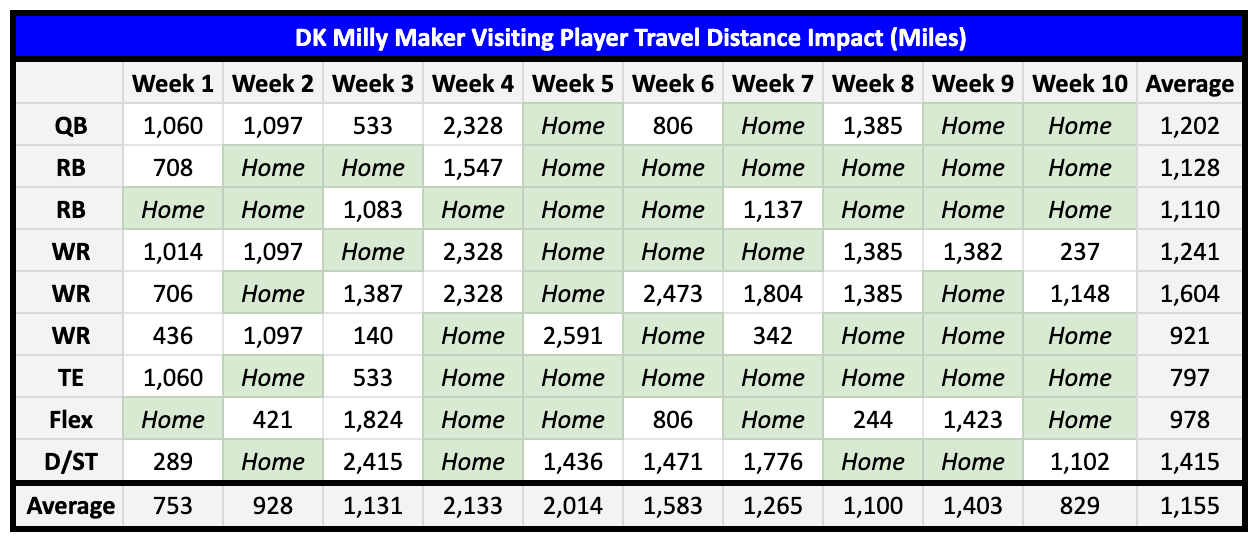
The final graphic examines the travel distances of Milly-winning players entering road matchups. This is the one factor examined that requires further thought. My eyes just can’t get past seeing only 29 of the 74 skill positions selections (39.1%) since Week 1 coming from visiting teams. That number dropped to 30% over the last six weeks – an average of three per line. As for the average travel distances, it’s pretty apparent that the distance from home is not a considerable factor. The average 1,415 miles traveled from their home cities at D/ST shatters all expectations of using an implied home-field advantage to dictate the selections.
ATS Picks
YTD: 44-47
Green Bay Packers (-3.0) vs. Tennessee Titans
Carolina Panthers (+13.5) at Baltimore Ravens
Chicago Bears (+3.0) at Atlanta Falcons
Los Angeles Rams (+4.5) at New Orleans Saints
Las Vegas Raiders (+2.5) at Denver Broncos
Dallas Cowboys (EVEN) at Minnesota Vikings
Los Angeles Chargers (+7.0) vs. Kansas City Chiefs
ATS Underdog Lock of the Week
YTD: 4-1
Arizona Cardinals (+9.5) vs. San Francisco 49ers
Pick-6 ATS Locks of the Week (≤ TD Favorites)
YTD: 27-22
Buffalo Bills (-8.0) vs. Cleveland Browns
New York Giants (-3.0) vs. Detroit Lions
New England Patriots (-3.0) vs. New York Jets
Philadelphia Eagles (-6.5) at Indianapolis Colts
Washington Commanders (-3.0) at Houston Texans
Cincinnati Bengals (-4.0) at Pittsburgh Steelers
Game Totals
YTD: 49-45
Tennessee Titans at Green Bay Packers (Under 41.0)
Carolina Panthers at Baltimore Ravens (Under 40.5)
Los Angeles Rams at New Orleans Saints (Under 39.0)
New York Jets at New England Patriots (Under 38.5)
Philadelphia Eagles at Indianapolis Colts (Over 43.0)
Kansas City Chiefs at Los Angeles Chargers (Over 50.0)
San Francisco 49ers at Arizona Cardinals (Under 43.5)
Overlooked Shootout of the Week
YTD: 3-2
Las Vegas Raiders at Denver Broncos (Over 41.5)
Pick-6 Game Totals of the Week
YTD: 26-23
Chicago Bears at Atlanta Falcons (Over 50.0)
Cleveland Browns at Buffalo Bills (Over 43.0)
Detroit Lions at New York Giants (Under 46.0)
Washington Commanders at Houston Texans (Under 40.5)
Cincinnati Bengals at Pittsburgh Steelers (Over 41.0)
Dallas Cowboys at Minnesota Vikings (Over 47.5)
Moneyline
YTD: 45-43
Green Bay Packers (-165) vs. Tennessee Titans
Baltimore Ravens (-665) vs. Carolina Panthers
New Orleans Saints (-205) vs. Los Angeles Rams
New England Patriots (-165) vs. New York Jets
Las Vegas Raiders (+125) at Denver Broncos
Dallas Cowboys (-120) at Minnesota Vikings
San Francisco 49ers (-365) at Arizona Cardinals
Underdog Lock of the Week
YTD: 2-3
Chicago Bears (+180) at Atlanta Falcons
Pick-6 Straight Locks of the Week (≥ -500 Favorites)
YTD: 30-22
Buffalo Bills (-365) vs. Cleveland Browns
New York Giants (-162) vs. Detroit Lions
Philadelphia Eagles (-285) at Indianapolis Colts
Washington Commanders (-165) at Houston Texans
Cincinnati Bengals (-195) at Pittsburgh Steelers
Kansas City Chiefs (-285) at Los Angeles Chargers
QB Matchups to Target
Justin Fields, CHI ($7.6K DK | $8.7K FD) vs. Falcons’ Cover 2 | 3
Is it more important to see players featured in matchups to target that fall outside of the general expectation, or does the importance lie with identifying those most likely to pace the position? Anyone more interested in write-ups searching to create headlines at all costs or in going overboard contrarian just for the sake of being contrarian will not need to search very long to find a trail of industry articles each week that could encircle the globe with those dramatic approaches. For everyone looking to actually compete for the Milly, you’ve uncovered analysis anchored into the bedrock toward that end.
We’re not going to take anyone by surprise with Justin Fields after he just supplied 45.7/42.7 and 43.4/40.4 FPs (DK/FD) the last two weeks to pace the position. Any NFL player that accounts for an average of 3.25 TDs in four consecutive weeks is going to draw everyone’s attention. That’s quite all right. We don’t need to concern ourselves with the actions of others. That includes perceived ownership. Identify the players most likely to go five times over salary (5X) and pounce. Could Soldier Fields possibly make it three games in a row with 40-plus and capture another QB1 crown? Without question. Fields definitely didn’t evade the attention of DK salary setters. Exposure to him this week comes with a 14.5% boost in salary ($1.1K).
Did DK price us out on Fields? He’s featured so the answer is obvious. Look at it this way, using his average FPs from the last two weeks (44.55), Fields’ salary would need to be $8.9K – $400 more than QB1 Josh Allen this week – to push him outside of the five times salary bracket. Does the Atlanta defense present a proper matchup for us to expect Fields to hit on another 40-plus? The Falcons are permitting opposing offenses to score 102.0 FPG, the highest in the league. The averages suggest the Dirty Birds have limited opposing QB production – only 2.09 rushing FPG (11th-fewest). Digging deeper, the closest thing to a dual-threat QB Atlanta has faced this season has been Geno Smith. Even then, they’ve actually handed out 0.91 FPs/rushing attempt to opposing QBs (ninth-most) overall and that number has spiked further to 1.46 (second-most) over the last four weeks (three games).
The Falcons are yielding the most passing YPG (280.1), second-highest completion percentage (69%), second-most passing YPA (7.39), eighth-highest passer rating (95.5), second-most total YPG (399.5), fourth-highest third down conversion rate (46.6%), fifth-most red zone (RZ) touches/game (5.6), seventh-highest rushing first down rate (27.4%) and fifth-most rushing TDs/game (1.30). Solely out of supporting the attention already pointed out to the Cover 1 and 3 exploiters dominating winning Milly lineups and for that reason alone, I’ll pass along that Atlanta is utilizing the fourth-highest rate of Cover 3 (38%). The evidence pointing to a third-straight nuclear performance from Fields is completely overwhelming in favor, independent of any scheme expectations.
Marcus Mariota, ATL ($5.5K DK | $7.2K FD) vs. Bears’ Cover 1 | 2 | 3
If the mistake is made to read too much into the pace of play between Chicago and Atlanta – the teams combine for the third-slowest on the main slate at 120.0 plays/game, it’ll result in missing the forest for the trees. Everyone moving forward with that fear will lose the fact that these two defenses supply two of the top-seven rushing first-down conversion rates and two of the top-five third-down conversion rates. They combine to permit the most combined points to their opposition on the main slate (49.7). Since you’re reading this analysis, I’ll assume I have at least some of your trust. In my view, Chicago and Atlanta also feature two of the top-five run-blocking O-lines. The Bears and Falcons sit first (31.5) and second (31.4), respectively, in rushing attempts/game.
We have a clash between expert practitioners in the ways of forward blocking, countered with significant defensive deficits in slowing down rushing attacks, and both sides featuring one of the top-five most dangerous rushing QBs in the world. Points are going to be scored, most likely in excess of the implied total (50.0). The final factor that has my mind decided on Fields landing as the QB1 is the excellent fit between the Atlanta offense across from the Chicago defense. It’s my expectation that neither side will find much difficulty in powering their offenses forward. Why should I even be considering Marcus Mariota if I’m so decided on Fields? For one, as already mentioned, we need to account for the potential for a Fields injury. Two, even if Fields does go for 40-plus, his QB4/QB3 pricing could limit our lines from capturing certain setups. Also, my weekly Milly line construction process is always built around featuring three QB headliners.
Like for Fields, Mariota’s matchup floor is independent of scheme or passing production. That gets us 60% of the way. We need both QBs to supply the remaining 40% through the air to hit that beautiful 5X. With a salary 27.6% lower than Fields ($2.1K), that 5X expectation is also 27.6% lower at 27.5 FPs. Through 10 games, Mariota has representations of 20.8 FPs (W2), 24.2 (W6) and 24.4 (W8) as his season highs. Carolina represents the most vanilla defensive matchup from Mariota’s schedule and they rank as a top-20 defense. The Bears are the worst overall defense in the NFL, with the atrocious run defense from the Texans leaving them as a close second. Three points over Mariota’s season-high against this Chicago defense should not be a difficult expectation to satisfy.
Daniel Jones, NYG ($5.7K DK | $7.8K FD) vs. Lions’ Cover 1
The decision to land on Daniel Jones as my third QB for Week 11 was more difficult than I originally anticipated. The presentation of the Dak Prescott-Kirk Cousins matchup gave my mind fits. The two factors that led me to Danny Dimes were his salary discount and facing off with a monumentally softer defense from Detroit. Yes, the Lions and Giants will be forced to play outdoors. Yes, the weather forecast calls for 16 MPH winds. However, Jones offers the rushing upside that should completely negate any limitations the wind may present in passing over the top. To the surprise of nobody, Detroit has issued the most FPG to opposing QBs (23.0). That baseline average already boosts us 81% of the way to 5X. Even though the weather may not allow for crazy aerial production, the Lions’ pass defense that’s provided QBs with the second-most FPs/passing attempt (0.50) is significantly better than last week when Jones worked against the stingy Houston defense (0.38 – 11th-fewest).
Houston’s offense didn’t manage to hit double-digit points until 37 minutes into Week 10. They also played over 70% of the second half down by double-digit points. Jones had little reason to push the envelope through the air, much less so with his legs. The Texans rank fourth from last in total offensive YPG (321.2) and fifth from last in PPG (16.6 – 0.6 fewer than they managed against the Giants). The Lions, on the other hand, have generated the seventh-most total YPG (383.5) and ninth-most PPG (24.3). The expectation is that Jones will have reasons to go on the offense.
Detroit’s defense may only feature the 11th-highest Cover 1 rate (28%), but they supplement their fourth-highest man coverage number with the fourth-highest rate of Cover 0 (4%) and second-highest of Cover 2-Man (10%). They mix in the 13th-highest rate of the zone version of Cover 2 to try to keep QBs from getting too comfortable. It definitely hasn’t worked based on the results of their first nine games. Jones is far from a polished product from any perspective. The Giants could simply choose to wash their hands of him at season’s end. That holds zero importance this week.
One of the few areas of Jones’ game that has seen positive results is when facing man coverages. On 24% of his dropbacks the last three seasons, Jones has accounted for 27% of his yardage, 30% of his TDs and only 15% of his INTs against man coverage. He also ranks seventh-best in FPs/attempt (0.42), while his TD-INT split (3.2) is the 13th-best. Finalizing the play, Detroit is kindly empowering 1.07 FPs/rushing attempt (second-most) for opposing QBs this season, 1.30 over their last four games (third-most).
Alternative Targets
Joe Burrow, CIN ($6.8K DK | $8.3K FD) vs. Steelers’ Cover 1 | 2
Dak Prescott, DAL ($6.6K DK | $7.5K FD) vs. Vikings’ Cover 3 | 4 | 6
Kirk Cousins, MIN ($6.1K DK | $7.6K FD) vs. Cowboys’ Cover 1 | 2
QB Matchups to Avoid
Jared Goff, DET ($5.4K DK | $6.8K FD) vs. Giants’ Cover 1
Justifying the viability of Danny Dimes going 5X requires certain expectations from the Lions’ offense, as well. However, Detroit’s offense relies upon running the ball at the 11th-highest rate (42.7%). With that in mind, Jared Goff’s complete lack of rushing upside leaves him vulnerable to the weather conditions stunting his already poor vertical game. Deep shots are not really Goff’s thing anyway – at least not until the eventual arrival of Jameson Williams. The presence of 16 MPH winds may completely wipe out the 15% of his weekly FPG infused from throws of at least 20 yards (10th-fewest).
A massive 60% of Goff’s FPG has been supplied on throws of less than 10 yards (fifth-most). That ensures that the underneath YAC-based players such as Amon-Ra St. Brown and D’Andre Swift will at least maintain production expectations and will likely see a boost once Goff eliminates all efforts to throw deeper. Which brings us to the Week 11 expectations from Goff.
The Giants are powering the highest rate of Cover 1 (37%) and the highest of Cover 0 (6%) in the league. Throwing those at ARSB – a top-10 man coverage practitioner – will play out very nicely for investors. The receivers that will see the weather devastate their production the most will be Josh Reynolds (14.4 air YPT), Kalif Raymond (11.1) and, if he’s activated, D.J. Chark (18.4). Goff will be expected – an ask that should be zero trouble – to support St. Brown’s 112th-ranked air YPT (6.4) – 122 qualified WRs – in order to tap into his 5.8 YAC/reception (24th-most) and to check down to Swift. Expectations beyond those tasks will be a tall order from Goff’s game-managing tendencies.
Zach Wilson, NYJ ($5.0K DK | $6.7K FD) vs. Patriots’ Cover 1 | 3
Nobody is going to enter Week 11 with immediate intentions to spend money on entries with Zach Wilson as the headliner. At least, I hope not. It took the first receiving TD by a QB in Jets’ history to force-feed Wilson his only output above 15 FPs from his first four games (20.8 in W4). Then we have the results from Week 8 across from New England (22.4 FPs), which could lead to some confusion. In order to account for that number, Wilson took full advantage of the absence of Kyle Dugger to connect on a 6-79-2 receiving line with Tyler Conklin – 50% of Wilson’s FPs. One of Dugger’s replacements in that game, Joshuah Bledsoe, supplied both of Conklin’s TDs during his 13 snaps in coverage. On 165 coverage snaps this season, Dugger has allowed a single TD. With Dugger returning in Week 9 and the rest of the secondary entering this matchup healthy – sans an illness keeping Jonathan Jones out of practice that shouldn’t prevent him from playing, as long as the expectations are limited to 15 FPs-or-fewer, Wilson should have zero problems satisfying the forecasted calculations.
Taylor Heinicke, WAS ($5.3K DK | $6.8K FD) vs. Texans’ Cover 2 | 3
The Commanders are a better football team with Taylor Heinicke under center rather than Carson Wentz. Provided he is given the proper time to adjust to the speed of the NFL game before finalizing opinions, Washington would eventually be a better football team with Sam Howell at QB than Wentz. Howell’s powerful right arm and dual-threat skillset support the rookie as a better long term option than Heinicke.
Since that’s neither here nor there, the focus is on Week 11 and Heinicke. As alluded to above, Houston has been one of the most difficult defenses for QBs to assemble passing production against. Their combination of holding offenses to the 10th-lowest completion percentage (63%), sitting right in the middle in permitting the 16th-fewest YPG (212.9) and the seventh-fewest passing TDs/game (1.0) has resulted in the 11th-fewest FPs/passing attempt (0.38).
That’s not to say Heinicke isn’t good enough to find his groove toward surprising in Week 11. The most significant challenge his numbers will face will be provided by his own offense. Antonio Gibson and Brian Robinson will go up against the most generous run defense in the league. The Texans are supporting the most rushing YPG (181.8), the most goal-to-go (G2G) carries/game to RBs (3.0), the most rushing FPG to RBs (24.3), and the most overall FPG to RBs (32.4). The limitations on Heinicke’s production are in place before the ball even touches the center’s hand.
Additional Avoids
Mac Jones, NE ($5.1K DK | $6.5K FD) vs. Jets’ Cover 4
Kenny Pickett, PIT ($5.3K DK | $6.9K FD) vs. Bengals’ Cover 2
Jacoby Brissett, CLE ($5.4K DK | $6.7K FD) vs. Bills’ Cover 2 | 4
WR1 Matchups to Target
CeeDee Lamb, DAL ($7.5K DK | $8.1K FD) vs. Chandon Sullivan, MIN
Chandon Sullivan put together a nice five-game stretch to begin the season. It appeared the 2018 UDFA was on his way to another quality year after his 2021 breakout. That’s until he ran into Tyreek Hill and Jaylen Waddle. The dynamic duo put a 6-113-0 line on his record and they managed it without Tua Tagovailoa. It’s a matchup that kicked off the current four-game stretch where Sullivan has permitted the sixth-most receiving yardage among 75 qualified corners. To date, Sullivan is sacrificing the third-most yards/coverage snap (YPCS, 1.53), fifth-highest targeted passer rating (TPR, 118.4), the sixth-most FPs/coverage snap (FP/CS, 0.29) and third-most FPG (11.3) among 37 qualified slot CBs.
This matchup with Dallas is about the worst time for Sullivan to be struggling. Not when a certain someone named CeeDee Lamb is on the other side of the line of scrimmage. Lamb is being fed with the second-highest target share (32%), 11th-most YPG (78.4), 11th-most air YPG (102.4) and 10th-most air yardage share (41%). Lamb avoided the attention his game deserves early on due to only scoring on a pair of TDs over his first seven games (5.4% TD rate). He’s now scored three in the last two games (18.8% TD rate) at the precise time the Cowboys must have him explode if they are to have any chance at making a run at Super Bowl LVII.
This matchup is implied for the second-highest combined total on the main slate (48.5). Minnesota has ceded the seventh-highest completion percentage (67%), fourth-most passing YPG (262.9), third-highest passing first down rate (37.6%), the third-most FPG to opposing WRs this season (40.1) and the most over their last three games (51.1). The Vikings employ the sixth-highest rate of Cover 4 and second-highest of Cover 6. Across the last three campaigns, Lamb has generated the 18th-most FPs/route (FP/Rt, 0.41) against Cover 4 among 98 qualified WRs. He ranks eighth-best in FP/Rt (0.43) over that same time against Cover 6 across 102 qualifiers. Lamb checks every box toward landing as my top WR play of Week 11.
Tee Higgins, CIN ($7.1K DK | $7.6K FD) vs. Levi Wallace, PIT
If not for Lamb, Tee Higgins would take the top spot. During the two games that Cincinnati has been forced to play without Ja’Marr Chase, neither Higgins nor Tyler Boyd have managed to go for at least 14 FPs on either platform. That changes on both fronts this week. On the positive side for the Steelers, T.J. Watt returned to action in Week 10. On the negative side, Minkah Fitzpatrick was unable to play last week due to an emergency appendectomy. Less than 24 hours after surgery, Fitzpatrick attempted to convince the staff that he could play. That attitude has obviously continued this week, with Fitzpatrick actually putting in a full practice on Thursday. As positive as his recovery is coming along, it would be quite an amazing recovery if Minkah managed to suit up eight days after having his stomach cut open to remove a failed organ.
Independent of Fitzpatrick’s status, the issues for the Steelers’ pass defense has been at cornerback, not safety. While Ahkello Witherspoon has been unable to practice this week, William Jackson appears set to make his Pittsburgh debut. Where he mixes in is the question. Cameron Sutton kicked outside several games back out of necessity. Since he has spent the majority of his time at the same right corner spot as Jackson, it’s my expectation that Sutton will move back to the slot, Jackson will defend at RCB and Levi Wallace will continue to work at left corner. Wallace has supplied his coverage responsibilities with 1.72 YPCS (seventh-most), 0.34 FP/CS (10th-most) and 7.84 FPG (14th-most among 86 qualified perimeter CBs).
The defense for the Steelers revolves entirely around the utilization of the fourth-highest rate of Cover 1 (33%). All longtime followers of this series will be well informed on Joe Burrow’s top-three Cover 1 excellence. As for Higgins, he ranks 15th-best out of 110 qualifiers in FP/Rt (0.49), 13th-best in air YPT (15.0) and with the 13th-highest TD rate (14.3%) across from Cover 1 during his career. It’s a stretch that has seen Higgins score 38% of his career TDs on only 21% of his routes. This is expected to be one of the first games played this season in temperatures south of 30°F, but the wind will be negligible and the conditions will be clear.
Additional WR1 Targets
Amon-Ra St. Brown, DET ($7.2K DK | $7.8K FD) vs. Darnay Holmes, NYG
Tyler Boyd, CIN ($6.5K DK | $6.8K FD) vs. Cameron Sutton, PIT
WR2 Matchup to Target
Darius Slayton, NYG ($5.0K DK | $6.3K FD) vs. Jeffrey Okudah, DET
Detroit must be beside themselves with appreciation that Jeffrey Okudah is developing into the type of corner that could one day become a serious shadow threat over opposing No. 1’s. If he were already at that point, you would not be reading this Darius Slayton tout. Slayton will see more than enough reps away from Okudah to take advantage of this sexy setup. Left for dead in a crowded WR room for a new head coach and offensive coordinator, Slayton has taken full advantage of an opportunity provided after the Giants received next-to-nothing from its WR rotation. He had all of a 1-11-0 receiving line to account for his first three games. However, over the last five, Slayton has assembled an 18-316-2 line from 26 targets. The culmination of his resurgence took place last week when he accounted for 48% of the receiving yardage for NYG.
As already examined, the Lions play a lot of man coverage. During this interpretation and his previous productive life as an NFL WR, Slayton has showcased outstanding production across from Cover 1. He ranks 25th-best in FP/Rt (0.44) and fourth-best in TD rate (18.2%) when defended by single coverage the last three seasons. Over that time on 26% of his routes, Slayton has collected 33% of his targets, 31% of his receptions, 40% of his yardage and 53% of his total TDs against Cover 1. Keep in mind that these numbers persisted through the unproductive stretch from Slayton last season. We’ve already covered the defensive passing allowances from Detroit, setting Slayton up for a big game even if the 20-plus targeting range is removed from the table due to the weather.
Additional WR2 Targets
Jakobi Meyers, NE ($5.5K DK | $6.6K FD) vs. Michael Carter, NYJ
George Pickens, PIT ($5.2K DK | $6.0K FD) vs. Eli Apple, CIN
Darnell Mooney, CHI ($5.4K DK | $6.0K FD) vs. Isaiah Oliver, ATL
WR3 Matchup to Target
Parris Campbell, IND ($4.3K DK | $5.8K FD) vs. Josiah Scott, PHI
The WRs for the Colts may not have stated anything publicly, but it’s very likely that they played a hand in getting Matt Ryan reinstated as the starter. The offense had clearly hit a literal wall with Sam Ehlinger’s wobbly arm delivering the targets. Ryan is not going to be anything more than the checkdown king he was earlier in the year. That’s a reality that, like ARSB, plays directly into the YAC-specialty of Parris Campbell. Through 10 weeks, Campbell’s air YPT average sits at 5.2 (third-lowest). But he’s provided 5.9 YAC/reception in return (23rd-most).
The Eagles recently placed Avonte Maddox on IR. His spot defending the slot will fall to Josiah Scott. We have qualifying coverage snaps from Scott, so we can properly evaluate the upcoming situation for Campbell. He’s handing out the 11th-most YPCS (1.26), eighth-most air yards/coverage snap (AY/CS, 0.04), the fourth-highest TPR (122.6) and the eighth-most FP/CS (0.29) among 37 nickelbacks. Philadelphia’s defense will enter this matchup angry after taking their first defeat on Monday. A vicious pass rush should only serve to convince Ryan checking more targets down to Campbell.
Additional WR3 Targets
Garrett Wilson, NYJ ($4.9K DK | $6.2K FD) vs. Jalen Mills, NE
Wan'Dale Robinson, NYG ($4.6K DK | $5.7K FD) vs. Will Harris, DET
Ben Skowronek, LAR ($3.9K DK | $5.3K FD) vs. Chris Harris, NO
WR Matchups to Avoid
Michael Pittman, IND ($6.1K DK | $6.7K FD) vs. Darius Slay, PHI
This is one of only two true shadow situations to account for from the main slate. Michael Pittman is going to have a rough go of it this Sunday. Darius Slay has been one of the very elite shutdown corners all season. He just concluded the second of his two annual clashes with Terry McLaurin. When F1 McLaurin brought in a 41-yard reception inside Slay’s coverage, it wasn’t only the longest gain Slay had allowed this season by 12 yards, McLaurin’s 85 receiving yards represent the most he’s allowed by 27. Slay has only allocated his shadow responsibilities 0.78 YPCS (20th-fewest among 86 qualifiers), a 46.4 TPR (fourth-lowest – 20.4% below spike passer rating) and 0.16 FP/CS (18th-fewest). Better days are definitely ahead for Pittman. Literally in terms of getting past this matchup, and figuratively now that his future will be without Sam Ehlinger.
Davante Adams, LV ($8.7K DK | $8.5K FD) vs. Patrick Surtain, DEN
This is a very volatile suggestion. The last time these teams met, Davante Adams assembled a 9-101-0 line (22.5/15.0 FPs) that was fed through 13 targets. Adams accounted for 5-54-0 of that line on nine targets under Patrick Surtain’s watch. Surtain also deflected two of those targets away. The Broncos are holding opposing WRs to the fewest YPG (112.6), the fewest TDs/game (0.33) and the second-fewest FPG (24.6). Surtain is the rock that supports those numbers. Without a serious receiving presence beyond Adams, if it were my decision, Surtain would be tucked into Adams’ back pocket throughout this game. The odds are against a true shadow of Surtain over Adams. However, Surtain has played 55.1% of his snaps at right corner. While Adams has aligned on the left perimeter on 47.4% of his reps, with 58.7% on the left side of the formation.
In spite of running 54.2% of his routes from the left side, Adams has yet to catch any of his targeted passes traveling at least 20 air yards to that side of the field. He has only caught four of his 18 targets of at least 20 air yards this season, but each of them were taken to the house (4-192-4). Adams has claimed 60.7% of his receptions and 40.3% of his yardage on targets with air yardage of nine yards or fewer. The Broncos are utilizing a scheme rotation that features the sixth-highest rate of Cover 1 (Man), ninth-highest of Cover 3, 15th-highest of Cover 4 and third-highest of Cover 6.
Adams collected 1-3-0 on his Cover 1 routes across from Surtain. Instead, he took advantage of the Cover 3 and 4 zones to account for 8-98-0 of his line (12 targets). This is precisely why I am recommending Adams as a Milly fade candidate. During that Week 4 game, Denver used Cover 3 and 4 on 76.3% of their plays. That strategy was scrapped after losing Ronald Darby for the season midway through Week 5. Since settling on a plan of action over the last three weeks, the Orange Crush have relied on a 48.2% rate of Cover 1. Their combined rate of Cover 3 and 4 of 57.9% they utilized the first six weeks, has plummeted by 35.5%, down to 37.3% over the last three.
Derek Carr has been the nemesis of the Denver franchise over the last five seasons. He’s defeated them eight times in their last 10 games. In the two the Broncos managed to win, they did so through a pair of one-point victories. It should also be noted that Carr ranks seventh-best among 44 qualified QBs the last three seasons with 0.49 FPs/dropback when facing Cover 1. Adams leads the entire qualified field with 0.89 FP/Rt when defended by Cover 1. Tossing a Milly dart at Adams is definitely not the worst idea. However, we would need 43.5 FPs from Davante to hit the 5X multiplier.
In addition, the significant boost from Denver in their Cover 1 rate will bring Adams and Surtain together at a far greater rate this time around. Surtain is holding his responsibilities to the third-fewest YPCS (0.45), eighth-fewest AY/CS (0.03), 13th-lowest TPR (65.1), 13th-fewest FPG (4.33) and third-fewest FP/CS (0.11). Over his last three games, Surtain has permitted a combined receiving line of 3-14-0 and 0.039 FP/CS. It’s a difficult decision whether or not to invest 17.4% of our DK cap into Adams that we all need to make under these stout conditions.
Allen Robinson, LAR ($5.6K DK | $6.6K FD) vs. Alontae Taylor, NO
Talk about difficult decisions. With Cooper Kupp landing on IR – potentially ending his season, it checks out that the Rams would begin peppering their three year, $46.5 million investment with targets. Allen Robinson could very well turn into a target hog over the final eight games before Los Angeles finds a cozy spot on their couch to watch the playoffs. To date, Robinson has aligned on the left side of the formation on 64.1% of his total reps, running 66.5% of his routes from the left. Marshon Lattimore has yet to practice this week, so the accountability of Robinson is going to fall on ‘22 second-round rookie Alontae Taylor since he’s defended the right side on 68.2% of his reps.
The Saints are employing the highest rate of man coverage this season (53%). That rotation includes the fifth-highest rate of Cover 1 (31%) and the highest rate of Cover 2-Man (20% – more than twice as high as any other defense). A matchup of a nine-year veteran defended by a rookie definitely has its appeal. Since entering the starting lineup four games ago, no other CB has seen his coverage targeted more (32) and only six others have defended more AY/CS (0.10). However, Taylor has limited his responsibilities to the 22nd-most receiving yards (140) among 53 qualifiers, while accounting for the third-lowest TPR (56.8).
Overall, Taylor is containing receivers to the 24th-fewest YPCS among 86 qualified outside CBs (0.87), the seventh-lowest TPR (55.1), 20th-fewest FP/CS (0.17) and he’s yet to allow a TD across 161 snaps in coverage. The singular concern with Taylor is in missing six of his 18 tackle attempts in coverage (33%). Robinson has accounted for 27% of his receptions and 28% of his yardage on only 23% of his routes vs. Cover 1 the last three seasons. However, he’s only found 19% of his TDs. Instead, the WR that stands out the most in this matchup is actually Ben Skowronek. He’s been a Cover 2-killer during his brief career, turning 13% of his routes into 31% of his receptions and 32% of his career yardage.
Drake London, ATL ($5.1K DK | $5.7K FD) vs. Jaylon Johnson, CHI
The two factors that will determine Drake London’s Week 11 fortunes are (1) whether the Falcons’ script calls for enough passing volume to feed the 25.5 FPs we would need to hit 5X in the Milly, and (2) which version of Jaylon Johnson shows up. London is averaging a 3.8-40.7-0.3 line this season. That’s only 38.3% of the way to 5X. Even if we double that line to 7.6-81.4-0.6, he would still fall 23.4% short. We would need a further 1.8-19.0-0.14 line boost to get up to the 9.4-100.4-0.74 line to hit five times salary. Based upon his 1.6 targets per reception average, London would technically need 15 targets to get up to those numbers. Drake is already seeing the 13th-highest target share (28%) and eighth-highest target/route rate (27%). London would set career highs in targets, receptions and yardage if he hit on those numbers, but doing so would definitely not be out of the realm of reason.
Since the Bears will bring the seventh-highest Cover 1 rate (30%) into the matchup, the specific corner London faces is a considerable factor. The rookie has aligned on the left side on 62.4% of his total reps, 63.1% of his routes. That lands him under the watch of Johnson since he’s aligned on the right on 76.7% of his snaps. Perhaps the most important factor standing in the way of London is the quality of coverage from Johnson that he’ll be dealing with on Sunday.
Prior to missing three games to injury, Johnson ghosted his responsibilities to a combined 1-9-0 line (three targets) and 0.029 FP/CS. Since his return, he’s supported the fourth-most receiving yards (245), sixth-most yards/reception (16.3) and ninth-highest TPR (120.5). However, 53.5% of that receiving yardage was collected on only three receptions from Tom Kennedy (44), Tyreek Hill (39) and DeVante Parker (43). That trio of catches also accounted for 34.8% of the total FPs he’s permitted the last five weeks. Taking them away, Johnson would have only yielded an average 2.6-22.8-0 line and 4.9 FPG. His passer rating from the last five weeks would decline by 30.2% down to 84.1.
Like Taylor, missed tackles have been an issue for Johnson. He’s missed 21.4% of them since returning from injury. They account for a considerable chunk of the 132 yards receivers have gained after the catch over that time (53.9%). London, in turn, has broken a tackle on 21.1% of his receptions. That said, he ranks 92nd-best out of 122 qualified WRs with a 3.2 YAC/reception average. Expecting Johnson to supply a long reception to London from the arm of a QB who ranks with the third-lowest passer rating on targets of at least 20 air yards will be opposed by considerable odds. Even more daunting, London would need the one thing Johnson has completely prevented all season: reception volume. Short of an injury knocking Johnson out, the odds are stacked too high against seeing a massive game from London in Week 11.
Additional Avoids
Amari Cooper, CLE ($6.4K DK | $7.2K FD) vs. Christian Benford, BUF
DJ Moore, CAR ($5.7K DK | $6.7K FD) vs. Marlon Humphrey, BAL
DeVonta Smith, CLE ($6.2K DK | $6.4K FD) vs. Isaiah Rodgers, BUF
Diontae Johnson, PIT ($5.8K DK | $6.3K FD) vs. Daxton Hill, CIN
TE Matchups to Target
Cole Kmet, CHI ($4.1K DK | $5.7K FD) vs. Mykal Walker, ATL
Go ahead and prepare yourself for the Cole Kmet detractors emerging from the weeds with their eternally-practiced pessimism that he will be unable to maintain this pace of production. Has Kmet emerged out of nowhere to score five TDs – the first five of his career, mind you – over the last three games? Yes. But have they actually come out of nowhere? What in the world could have changed over the last three weeks to account for Kmet’s sudden dominance? Oh yeah, Justin Fields happened. Over the last three weeks, Fields has racked up 385 yards and four TDs on the ground. Once again, anyone downplaying Kmet’s ability to keep this pace with the Bears running at the third-highest rate is missing the forest for the trees.
It’s actually due to their high rushing rate that Kmet has been able to find such incredible success. Defenses can only account for so many factors on a single play. They already lose one of their 11 defenders (the conflict defender) everytime Fields employs an RPO (Run-Pass Option). When defenses shift an eighth player into the box in attempt to slow down Chicago’s viscous rushing attack, the secondary is left out to dry with only three defensive backs dedicated toward coverage. That’s precisely when Fields looks toward Kmet. It’s a sequence of events that builds up toward Kmet chip-blocking his way into wide open looks. It definitely doesn’t hurt that the Falcons have permitted the third-most receptions/game (6.0), fifth-most YPG (59.0), fourth-most RZ targets/game (1.50), seventh-most G2G targets/game (0.6) and 10th-most FPG to opposing TEs (13.7).
Tyler Conklin, NYJ ($3.4K DK | $5.0K FD) vs. Kyle Dugger, NE
Tyler Conklin found his way onto the winning Milly Maker line in this same matchup three weeks ago (25.9 FPs). Here’s the thing, I actually have a good amount of doubt that Conklin will be able to repeat that performance. As mentioned earlier, the Patriots played without Kyle Dugger in that game. His presence this week will be a significant factor toward New England taking this game. However, my process toward employing TEs is to attack the average FPG allowances. The Pats have permitted TDs to TEs on seven occasions. They currently pace the league in that category at 0.78/game. Allowing the position to see the 10th-most RZ targets/game (1.22) goes a long way to explain the Patriots providing TEs with the seventh-most FPG (13.9). The final reason Conklin is featured is that his pricing only increased $200 from his big Week 8. Conklin is a process play, and I listen to the process.
Alternative Targets
Tyree Jackson, DAL ($2.5K DK | $4.0K FD) vs. Bobby Okereke, IND
Lawrence Cager, NYG ($2.5K DK | $4.5K FD) vs. Alex Anzalone, DET
TE Matchups to Avoid
Tyler Higbee, LAR ($4.0K DK | $6.2K FD) vs. Demario Davis, NO
If you keep up with this series, you are fully schooled in the presence of Demario Davis. He’s a one-man kryptonite on TE production. He has held his coverage responsibilities to the third-fewest YPCS (0.46), sixth-fewest AY/CS (0.008) and the second-fewest FP/CS (0.09) among 77 qualified LBs. As a team, the Saints are limiting opposing TEs to a single TD and the fewest FPG (7.8 – tied with the Rams). Tyler Higbee could see a few additional targets with Kupp on IR, but not enough to draw my interest in Week 11.
T.J. Hockenson, MIN ($5.3K DK | $6.5K FD) vs. Leighton Vander Esch, DAL
If any defender has been better than Davis at closing down coverage production among LBs, it’s been Leighton Vander Esch. He’s ghosted his responsibilities to 0.31 YPCS (the fewest), 0.007 AY/CS (fourth-fewest), an 85.6 TPR (ninth-lowest), 2.58 FPG (fourth-fewest) and 0.09 FP/CS (the fewest). T.J. Hockenson will need to supply us with 26.5 FPs to hit 5X. The Cowboys are holding opposing TEs to 9.2 FPG (eighth-fewest). Just check on Robert Tonyan’s thoughts about facing Vander Esch and Dallas – 2.7 FPs last week – before investing in Hock this week.


