
“Give a man a fish and you feed him for a day. Teach him how to fish and you feed him for a lifetime.” — Lao Tzu
Now that the pretentious and self-important opening quote is out of the way, the hope is that by now you’ve read Part I of Injury Prone is a Lie. That article outlines common misconceptions regarding the phrase and provides data to show why fantasy managers shouldn’t hyperventilate about most history injuries. Why? Because injuries happen in the NFL. Players are tough and move on — eventually. So, part I is the lecture and this is the lab. First, the methods of the pre-season “Volatility Score” is explained followed by a handful of case studies to discuss using the mode. Next, the article shifts gears and moves into how to think about specific injuries during the season to gain an advantage on the opponent.
Methods
If you read the Injury Volatility series last summer, this method of calculating risk is familiar. However, this specific method will be adjusted and refined in the off season to more closely reflect the data and attributes that help color the context behind injury histories. For today’s purpose, last year’s process provided a pragmatic framework to intelligently decipher injuries. The basic premise is that the best predictor of future injury is previous injury and positional demands, therefore the primary data will quantify just that:
1. Risk based on positional demands, and
2. Risk based on recurrence rates of common injuries.
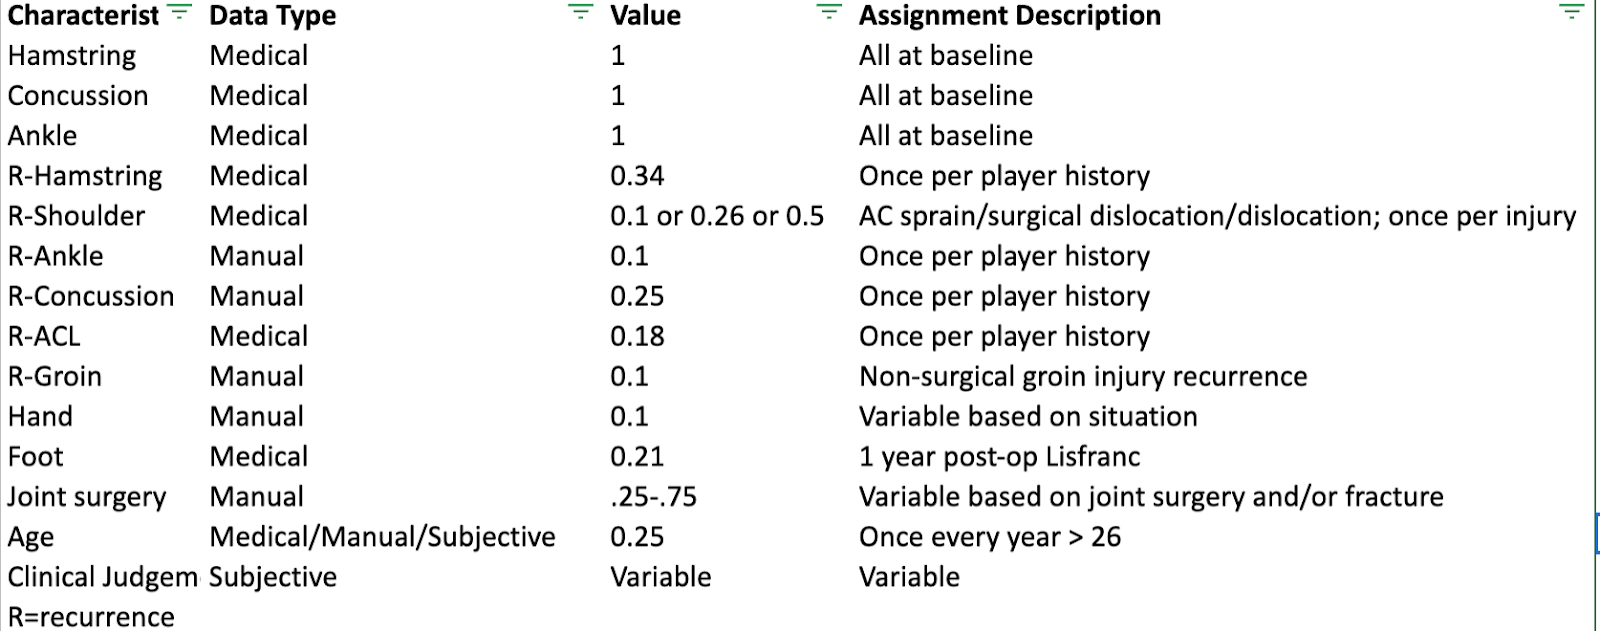
In 2020, the “concern” section was used to try and factor in athleticism and draft capital. Next year, it will be baked in. For now, to avoid getting bogged down with methods and data extraction, the final multipliers are listed in the tables below. Add up the factors based on the player’s history and that’s it. The higher the number, in theory, the higher the risk. Again, this is last year’s “model” and it will be updated this summer (that’s what they call a “tease” in the industry).
An important part to keep in mind: to represent the fact that every injury is not created equally, the “ concern” section was used to adjust for any discrepancy that might not truly represent a player’s volatility. This is similar to the idea of raw projections vs. rankings, and is the most subjective portion of the process. Apply your own clinical judgement based on gut feel. It’s your fantasy team after all.

(Running back legend)
(Pass catcher legend)
Lastly, this is not an injury prediction tool. It’s meant to highlight players who, according to data, might face difficulties with health and athleticism which could cap upside. The best way to think of this “model” is like a “sensitive” test in medicine. A sensitive test (as opposed to a specific test) is meant to detect a patient who cannot be ruled out for [X] condition. In other words, they tested positive for a highly sensitive test and warrant a work up to determine if they truly have condition [X]. However, if a person tests negative for condition [X], it’s highly unlikely they have condition [X]. A non-medical/real-life example is a metal detector at the airport. The metal detector sounds off at any hint of metal -- that metal can be a gun or a big belt buckle. The detector isn’t able to get “specific” about the metal, but it alerts the staff it’s worth a pat-down. If the metal detector doesn’t sound, the chances of any metal, let alone a gun, being present is very low. Similarly, this model follows the rule of thumb discussed in Part I: the best predictor of future injury is past injury. Once a player has an injury history, if it’s notable, detects the need for a deeper dive.
Application
Now, it’s possible to have a relatively high score (most “red light” RBs had a score above 5) but have a trajectory that’s either trending up or down. An example of a player who had a high score coming into 2020 and a downward trend was Mark Ingram. At age 30, on a team with a RBBC, a history of already having dropped out of the top 12 in fantasy scoring at the position, and a history of a recent calf strain, Ingram was an easy fade in 2020. Add in his incredible touchdown luck from 2019, and it was almost common sense he’d be toast by season’s end.
The tricky part about fading Ingram based just on the model, though, is that his score, before the “additional concern” box, was just 5 — almost enough to be in the yellow light tier. However, with the knowledge about his situation above, he shouldn’t have been on redraft rosters.
Another easy fade at the time was A.J. Green. Coming off of major ankle surgery and not having played a full season since the Paleloithic era with a massive hamstring strain in his past at 32 years old, the upside some of the fantasy community saw simply wasn’t based in objectivity.
Conversely, it’s possible to have a high score while having an upward trajectory. Take Evan Engram for example. A man who, before this year, was written off as injury prone due to concussions, MCL sprains, and a recent Lisfranc surgery. Now, from a re-draft perspective, he was a solid fade due to the expected 20% dropoff in performance for NFL players after Lisfranc surgery. But in the dynasty, it was an easy place to exploit a market inefficiency. Sure enough in 2020 his numbers were down and thanks to some dropsies, he had a massive decrease in production. However, he stayed healthy which was people’s gripe to begin with. Now two years removed from his last concussion and the Lisfranc, the former first=round draft pick who happens to be a freak athlete, could return to fantasy relevance.
Most importantly, this model helps determine the trajectory of middle round players such as David Johnson. There were some (who will remain unnamed) under the impression Johnson would finish as a top 12 RB in 2020. He ended as RB19 and towards the bottom of the yellow-light tier due to age, obvious lack of burst, and overall situation. Ultimately, Johnson was “fine”, but as Scott Barrett has been saying for a year now, Upside Wins Championships. Meanwhile, based on ADP data, Johnson was being drafted ahead of Terry McLaurin, Keenan Allen, D.K. Metcalf, Stefon Diggs, and Cam Akers. Listen, we’ve all made mistakes while drafting and hindsight is always 2020, but all of these players going after Johnson was simply inexcusable. This game is hard, but as long as proper context and objective information is applied into this scoring system, you can stay one step ahead of the competition.
David Johnson’s score: 5.15
Mark Ingram’s score: 5.75
A.J. Green’s score: 5.39
Evan Engram’s score: 4.66
As mentioned above, an updated version of these tables will be available later on this summer, but this initial version (which fared decently in year one) is still usable for you degenerates die-hards looking to jump into some early drafts.
In-Season Management
Player injuries, with appropriate analysis, create a wealth of opportunities to exploit other nervous managers. However, it’s much easier to calculate a static injury risk quotient than it is to adjust for a player’s physical volatility mid-season.
So, in addition to utilizing the method above, it’s important to know timelines and rehab progressions for the most common injuries to exploit market inefficiencies. Below is a list of injuries that are mostly unpredictable but can provide managers with some sweet, sweet fantasy football equity during the season. The injuries highlighted in red I would avoid during transactions. Conversely, I aggressively target players with MCL sprains, AC joint sprains and even small bone fractures quickly from panicked managers. Why? Because those timelines are neat, predictable, and the injuries are generally non-recurrent. This year I acquired Chris Godwin and Nick Chubb in separate leagues. Courtland Sutton would have been another good trade target to poach league mates after his AC sprain. One of the sharpest minds in the game, Graham Barfield, says that he doesn’t make a habit of trading for players who are injured. This simple piece of insight, planted almost six months ago, forced me to evaluate my own trading habits and create a more refined strategy instead of blindly chasing players for a quick injury discount.
First time concussions
Recurrence is a risk within the first 7-10 days and within that same season.
Contact ligament tears
More specifically, soft tissue injuries in the first year back from surgery aren’t surprising.
AC Joint sprains
If players return before 3-4 weeks, (2019 James Conner and Dak Prescott) things can turn sour quickly but typically these rehab well.
MCL sprains
A great blood supply and are generally non-recurrent.
Lateral ankle sprains
Generally recurrent though mostly benign — such is the case for DeAndre Hopkins.
Foot sprains
Joe Mixon is the floor with these while Chris Carson and Calvin Ridley are best-case scenarios. Small sample, but the window is wide ranging from 10 to 82 days on average.
Contusions
These are usually listed as “thigh” or just “bruise”. Worst case scenario these don’t knock players out longer than two to three weeks as was the case for George Kittle in 2019.
Small finger/hand fractures
These are incredibly fast to heal even after surgery, as demonstrated by Chris Godwin.
Rib fractures
Drew Brees and Cam Akers in 2020, Julian Edelman and Emmanuel Sanders in 2019. These are extremely painful and can linger for weeks. They can heal, but it takes time.
High-Ankle Sprains
Despite the blanket “4-to-6 weeks” speculations, the actual numbers based on the data since 2016 reads as follows:
0 Missed Weeks - 14%
1 Missed Weeks - 22%
2 Missed Weeks - 12%
3 Missed Weeks - 27%
4 Missed Weeks - 10%
5 Missed Weeks - 3%
6 Missed Weeks - 8%
7+ Missed Weeks - 5%
In other words, 36% of players (more than one third) have ended up missing zero or one game. Another 39% missed two or three games and only a measly 21% actually miss between four and six games. Unless Adam Schefter or Adam Caplan specifically reports “4 to 6 weeks” apply this data instead. What’s more is that there’s approximately a 17% drop in fantasy points in the first game back. This is in a sample of 60 skill players since 2016. That drop remained consistent for those averaging 9 ppg before the injury. Worse yet, there have been an average of 2 players who re-injure the ankle and that’s almost always a lost season at that point. A deeper dive into ankle sprains helps explain this stubborn injury as all 32 team physicians agree most players come back around 15 days but symptoms linger for 4-6 weeks. This is likely because the syndesmosis has a poor blood supply and swelling can be persistent. Additionally, because of the combined mechanism of injury, these can be associated with MCL sprains as was the case for Alvin Kamara in 2019. The cherry on top of this crap sundae is that they can also end up being worse than initially reported. Michael Thomas, Raheem Mostert, Jimmy Garoppolo are the most recent examples. On the bright side, this injury only recurred within the calendar year in one player from 2016-2020. The takeaway here is to understand as a high stakes player or cash game player that most guys coming off these injuries won’t reach their ceiling. Stay away unless you’re a maniac.
Concussions
As mentioned above, 44% of these first time documented concussions end up causing players to sit out at least one week. Recurrence is about 15-25%. Depending on the population being studied and the source, most athletes return to play by 7-10 days. However, there’s evidence athletes don’t truly recover until about the 29 day mark. Same applies here for cash game players: recurrence and risk is high within the first few weeks of return.
Hamstring Strains
From 2016-2020 there were 282 instances of hamstring strains on the injury report (mostly pass catchers). This is common as the positional demands dictate constant contraction/relaxation of the hamstrings. This year, workloads were thrown off and led to more soft tissue injuries as a whole. Some preliminary data suggests there’s about a 15% drop off in players in their first week back from hammies, but my personal hypothesis is that it’s due to the boom-or-bust nature of the injury in the first week back. Adam Thielen in 2019, Julio Jones, Keenan Allen, and Mike Evans in 2020 — players with these injuries are at high risk to lay a goose egg. Furthermore for in season management, from 2016 to 2019 approximately 20% recurred overall. Within the same season, about 14% recurred in players. These are sticky and finicky injuries I won’t actively trade for.
Miscellaneous
There are many rules of thumb for injuries and performance when managing a roster. Here are just a few:
- Concussions are dangerous and have approximately a 15-25% recurrence. About 56% of first time documented concussions end in the player sitting.
- Players coming off of major surgeries such as ACL, Achilles, and Lisfranc have a capped ceiling.
- Top 12 RBs are tightly between the ages of 22 and 26. The average and median is 24. Exceptions obviously exist, but this is something major to remember for top 12 potential.
- Top 12 WRs average age is between 24 and 28.
- Coaches and staff almost never tell the truth. Zac Taylor is the perfect example of this.
- Injury Prone is a lie.
Summary
This isn’t a magic bullet, but the hope is to get the ball rolling on moving away from “injuries are random” to actually using objective data and science to guide decisions that relate to performance and rehab in fantasy football.


