
A total of 2,692.2 full PPR FPs have been ponied up by the offensive skill positions combined across all 32 teams during the 2022 season. Don’t let that number impress you too much since the per franchise average allowance (84.1 FPG) only allots 16.2 (19.2%) for the QB, 22.9 for the RBs (27.2%), 33.0 for its WRs (39.2%) and 12.1 for the TEs (14.4%). Take notice of the plural forms of those positional acronyms. Defenses are permitting average FPG allowances ranging from the Falcons gifting out the most after nine weeks at 106.6 and the tight-arsed Broncos circulating the fewest at only 66.8.
Since we’re all attempting to dip into those DFS payouts, let’s take a skydive into the DK Milly Maker winning lineups through nine weeks. Let’s kick it off with a basic table layout of the players populating those nine lineups. You may need to squint your eyes a bit, but it’ll be worth the effort for a reminder on the conquering exposure strategies:

The bolded names are the players appearing in lineups on multiple weeks. The only repeat monster performers at QB have been Tua Tagovailoa and Joe Burrow. Alvin Kamara has been the only RB to Milly-pop three times, with each performance from the last five weeks. The two-timers include Austin Ekeler, Josh Jacobs, Kenneth Walker and, oddly enough considering his struggles this season, Leonard Fournette. Jaylen Waddle has aided four lineups toward the Milly, with teammate Tyreek Hill following close behind with three appearances. Ja’Marr Chase and Tyler Lockett are the only other two to materialize twice. Mark Andrews finished off the three-week run with top-two TE pricing capturing the money thanks to his Week 2 and 3 performances.
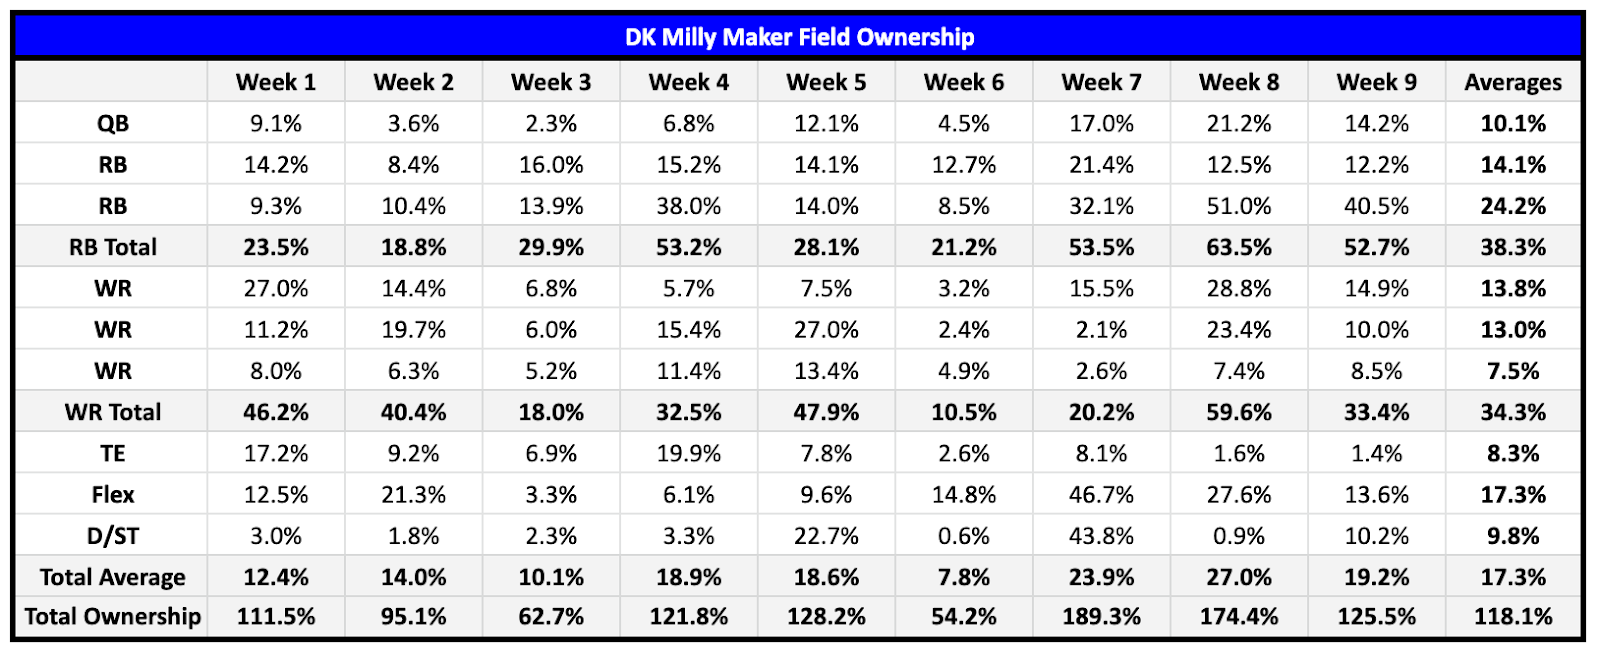
In fact, the only true contrarian efforts were supplied in Weeks 3 and 6. The table also clearly informs us that 75% of the winning entries were packing total ownership of at least 111.5%. The most consistent contrarian slots have been at the WR3 slot – lowest-priced WR, TE, and D/ST. The QB slot appeared set to join that group with four-straight selections under 10% – 5.45% average. However, the last five weeks have proved that it’s viable to go chalky at QB.
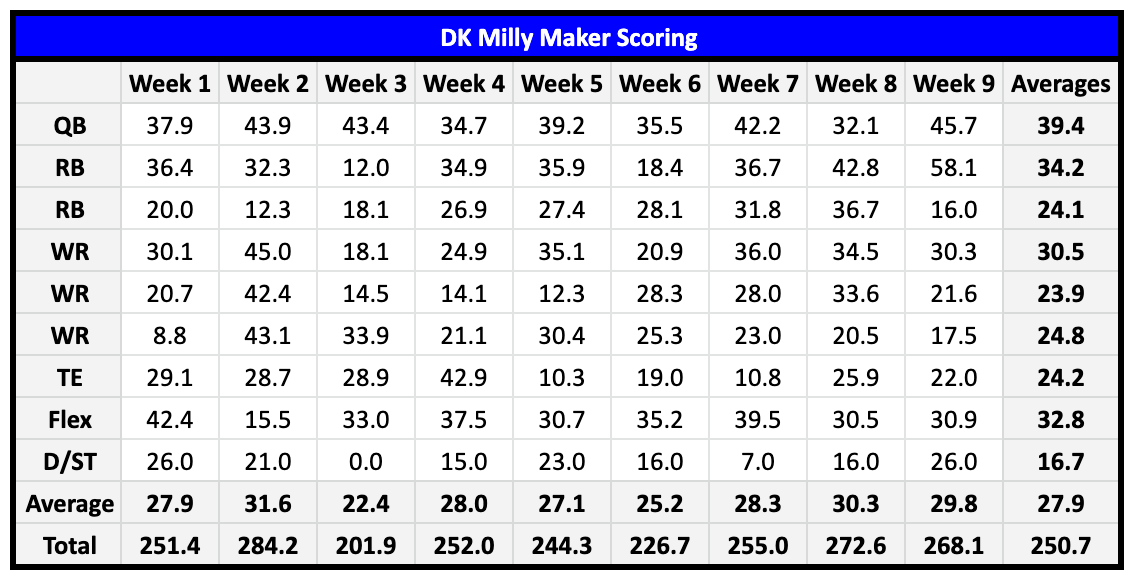
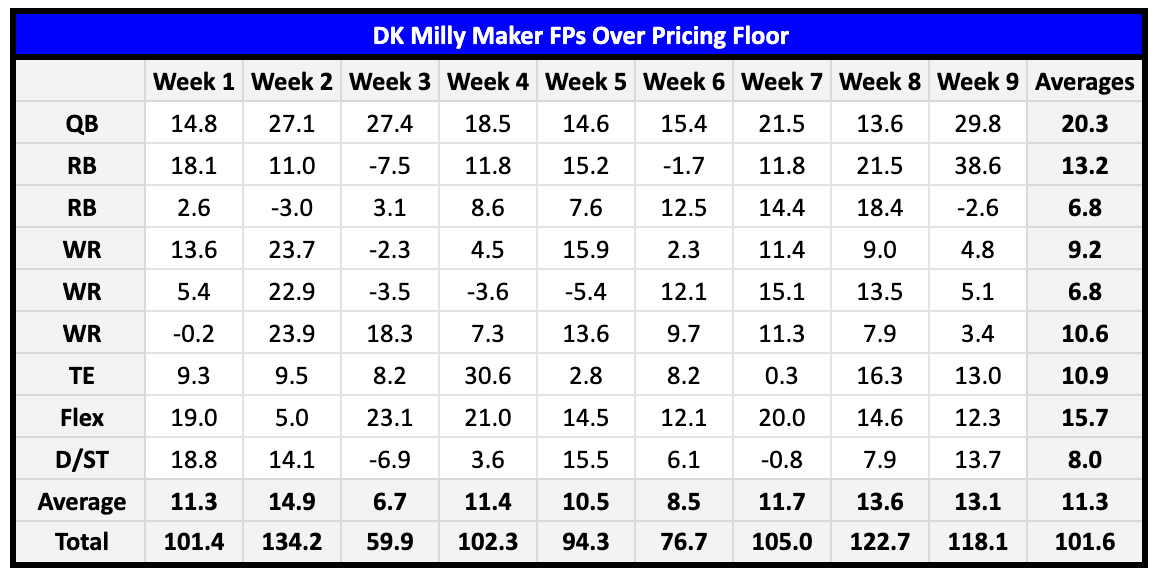
The table above is a straightforward listing of the individual scoring, as well as the positional averages and lineup totals. We see quite a bit of variance. That said, the crystalline takeaway is found in the unadulterated importance of nailing our QB, RB1, WR1, and Flex selections (Big 4). At the same time, when those lines succeeded in locking down that week’s breakout performer at each of those four spots, quite a bit of leeway was leveraged at RB2, WR2, WR3, and TE.
You can find the salary cap distributions for the winning lineups in the table below. Let’s start by underlining the fact that players priced at $8K or higher were only selected six times. Only one line slid two of them under the cap at once, while four were entirely assembled without them. The distribution of the $8Kers are as follows: two QBs, one RB, and three WRs.
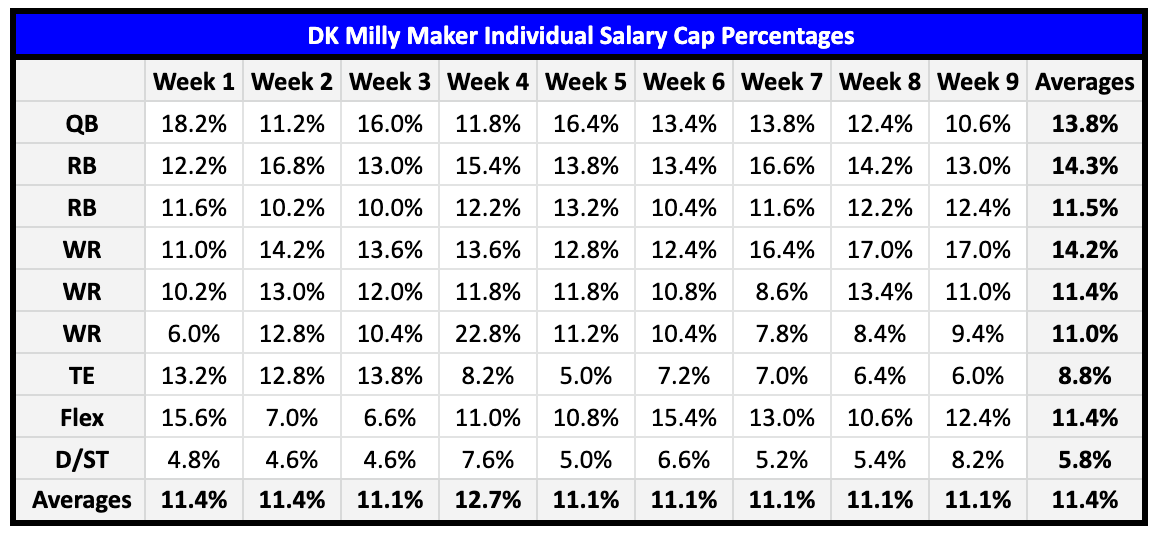
The next wall message is not as absolute, but it serves to ease up on the scoring requirements for the slots outside of the Big 4: slaying at every spot is obviously ideal, but the FP/$1K of pricing potential at TE and D/ST are not that far off from QB. The data furnishes a nice roundabout strategy toward scaling our expenditure at TE and D/ST: spend around the same amount at QB that you do combined at TE and D/ST. It’s less of a set-in-stone rule than a general estimated guideline. Another pattern that is supported by 89% of the winning lineups is devoting at least $6.5K or 13% of the cap at RB1. Saquon Barkley ($6.1K) was the only outlier back in Week 1. Early lines managed to get away with spending a cap average of 12.9% to their WR1s, just keep in mind that that requirement jumped by 23.2% over the last three weeks up to 16.9% or $8.45K.
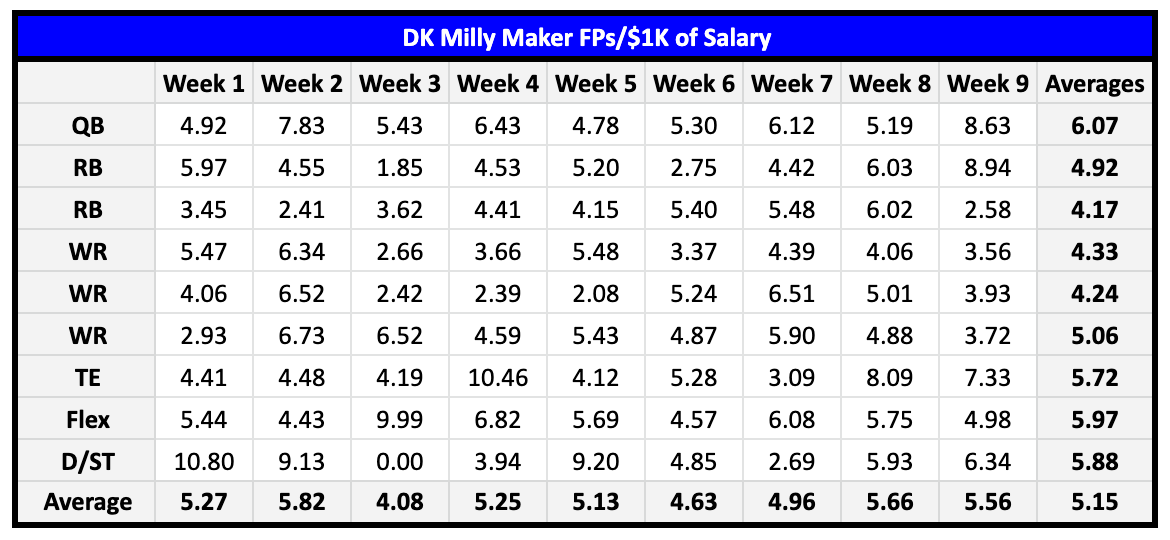
You’ll notice from the following table detailing the FPs scored to exceed an individual’s pricing floor that all nine of the winning lines were populated by QBs landing at least double-digit profit levels. Two-thirds of those QBs returned 15+, while 44% hit the 20+ paydirt to push the overall average to 20.3. No decision we make with our entries supersedes the vital significance in choosing the QB1 on the slate. The profitable returns study also reiterates the fact that our choice at Flex is not one that should end in tossing a blind dart into the dark. We need serious profit from that Flex selection that is only supplanted by the requirements at QB.
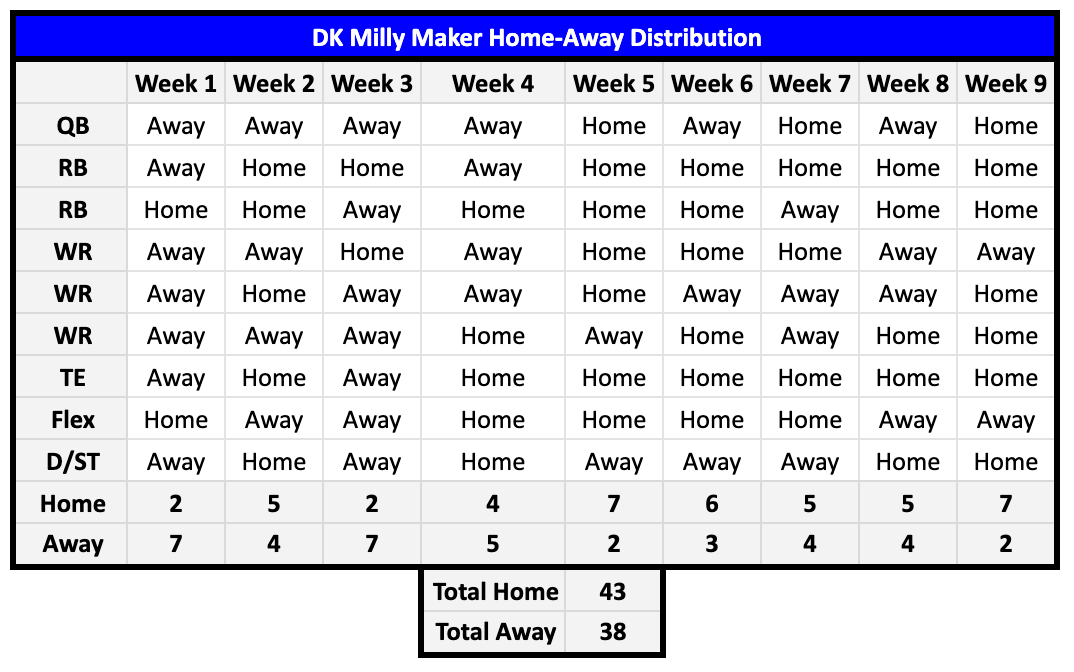
Does the Home-Away distribution from the winning lineups that you can find below offer value? In short, negatory, my friends. The data is all over the place. It’s bordering on zero viability. Perhaps the only pattern of note is from 73% of the RB selections – including those at Flex – playing on their home fields.
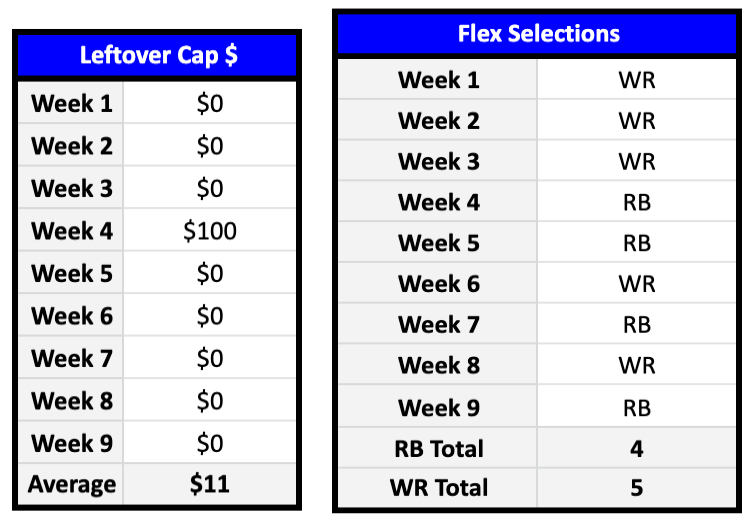
Before anyone tries to get cute by leaving cap dollars on the table, check the table on the left below first. A whopping $100 of the combined $450,000 cap dollars went untouched by the nine Milly winners. I was rather surprised to see that four of the nine lines were successful with a RB at Flex. Just keep in mind that those four RB selections returned an average of 34.7 FPG.
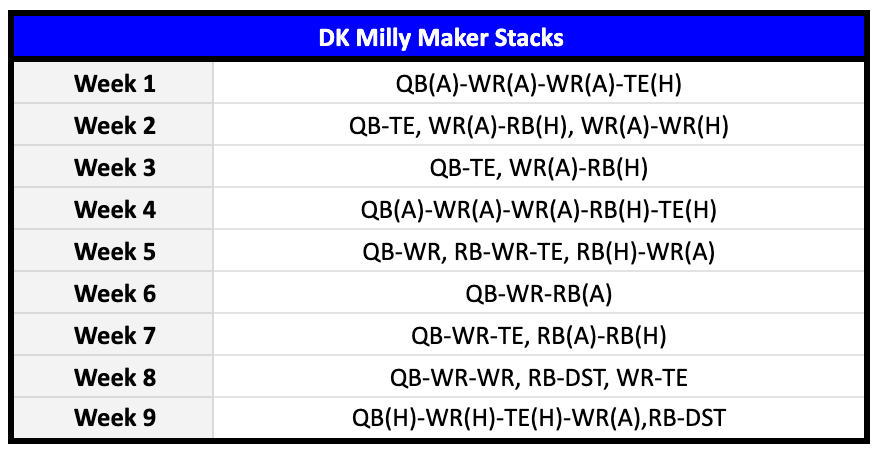
The Stack table below requires some setup. We’ll use the entry on the Week 2 line. The QB-TE stack is straightforward as a QB and TE correlation from the same team. The next entry presented is a WR from the away team (A), tailed by the RB from the home team (H). The rest are self-explanatory.
The takeaways are as follows:
The most obvious, all nine lines featured at least one stack.
All nine QB selections were shadowed with at least one of his receivers.
Four of the QBs were only stacked with one receiver.
That leaves five (56%) of the lines with two receivers attached to their QB.
Three examples extended the stack with a runback from the other sideline.
Runbacks are only gracing 33% of the lines so resist any feelings of obligation in including them as an entry staple.
Many cherish their attachments to RB and DST correlations, yet only two of the lines (22%) featured that strategy.
The final suggestion is to mix-and-match the stack configurations, in place of a set configuration.
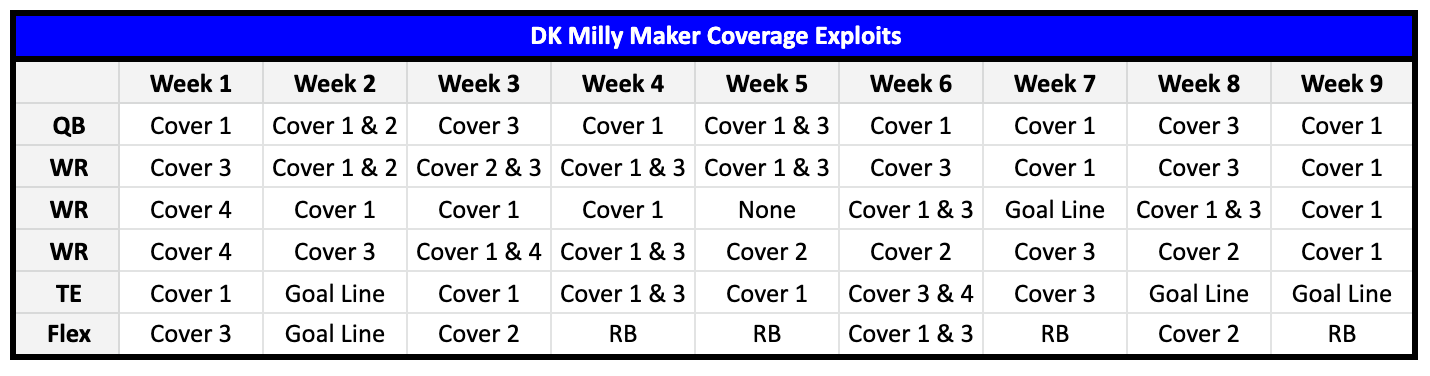
How does all of this Milly Maker analysis tie in to Advanced Matchups? The table above should provide all the proof required to solidify the viability of digging as deep as possible into the matchups each week to iron out our passing-game options. A total of 26 of the 50 exposures (52%) at QB, WR, and TE from the nine lines took advantage of the Cover 1 offerings distributed by opposing defenses that week. A further 18 individuals (36%) found their success across from Cover 3. As a reminder, Cover 1 and 3 combine for 54% of the total average of the defensive shells offenses have faced through nine weeks. While the 11 players (22%) that found at least half of their success across from the split-safety setups of Cover 2 and 4 are a bit trickier to identify in advance, we still had the in-hand scheme tendency percentages in advance.
The only passing game outliers evading the coverage success approach were Mecole Hardman in Week 6 (long rushing TD), Greg Dortch in Week 2 (TD reception in a goal-to-go) and the three TEs that did almost the entirety of their work facing goal line-specific schemes. Those three TEs also solidify the unreliability of focusing entirely on the defensive scheme setup. We should always focus the majority of our TE selection sequence toward identifying the defenses vulnerable to TE production. It definitely doesn’t hurt to scan the history of scheme success, but general defensive vulnerability is the most consistent green arrow pointing toward inline production.
ATS Picks
YTD: 41-42
Atlanta Falcons (-3.0) at Carolina Panthers
Seattle Seahawks (+2.5) at Tampa Bay Buccaneers
Detroit Lions (+3.0) at Chicago Bears
Jacksonville Jaguars (+9.5) at Kansas City Chiefs
Minnesota Vikings (+5.0) at Buffalo Bills
Los Angeles Rams (-3.0) vs. Arizona Cardinals
San Francisco 49ers (-7.0) vs. Los Angeles Chargers
ATS Underdog Lock of the Week
YTD: 3-1
Washington Commanders (+11.0) at Philadelphia Eagles
Pick-6 ATS Locks of the Week (≤ TD Favorites)
YTD: 24-20
Tennessee Titans (-3.0) vs. Denver Broncos
Miami Dolphins (-3.5) vs. Cleveland Browns
New York Giants (-6.5) vs. Houston Texans
New Orleans Saints (-2.5) at Pittsburgh Steelers
Las Vegas Raiders (-6.0) vs. Indianapolis Colts
Dallas Cowboys (-5.5) at Green Bay Packers
Game Totals
YTD: 46-41
Atlanta Falcons at Carolina Panthers (Over 43.0)
Seattle Seahawks at Tampa Bay Buccaneers (Under 44.5)
Minnesota Vikings at Buffalo Bills (Under 45.0)
Cleveland Browns at Miami Dolphins (Under 49.0)
Arizona Cardinals at Los Angeles Rams (Under 43.0)
Los Angeles Chargers at San Francisco 49ers (Under 45.5)
Washington Commanders at Philadelphia Eagles (Under 44.0)
Overlooked Shootout of the Week
YTD: 3-1
New Orleans Saints at Pittsburgh Steelers (Over 40.0)
Pick-6 Game Totals of the Week
YTD: 22-21
Detroit Lions at Chicago Bears (Over 48.5)
Jacksonville Jaguars at Kansas City Chiefs (Under 50.5)
Denver Broncos at Tennessee Titans (Under 38.5)
Houston Texans at New York Giants (Under 41.0)
Indianapolis Colts at Las Vegas Raiders (Under 42.5)
Dallas Cowboys at Green Bay Packers (Under 43.0)
Moneyline
YTD: 43-38
Atlanta Falcons (-160) at Carolina Panthers
Chicago Bears (-150) vs. Detroit Lions
Tennessee Titans (-150) vs. Denver Broncos
Buffalo Bills (-230) vs. Minnesota Vikings
Los Angeles Rams (-170) vs. Arizona Cardinals
San Francisco 49ers (-310) vs. Los Angeles Chargers
Philadelphia Eagles (-550) vs. Washington Commanders
Underdog Lock of the Week
YTD: 2-2
Seattle Seahawks (+120) at Tampa Bay Buccaneers
Pick-6 Straight Locks of the Week (≥ -500 Favorites)
YTD: 27-19
Kansas City Chiefs (-470) vs. Jacksonville Jaguars
Miami Dolphins (-195) vs. Cleveland Browns
New York Giants (-280) vs. Houston Texans
New Orleans Saints (-140) at Pittsburgh Steelers
Las Vegas Raiders (-260) vs. Indianapolis Colts
Dallas Cowboys (-235) at Green Bay Packers
Short note: Before going any further, an alteration to the setup of this article series deserves mention that, while few if any are likely to spot, my source for the initial coverage scheme data that I utilize as a baseline before adjusting as I go through each game during my weekly film study has changed. A good number of plays each week require more than the time I have available to properly identify. It’s vital that I have a reliable source on the back end that I can defer to with as close to the utmost confidence as possible in order to complete my process in time each week. Some inconsistencies from my previous source forced the switch.
Prior to this week, the delay in the releases of my article series’ by a day have resulted from personal health-related factors. My articles will be published a day later this week due to entirely reworking all of my spreadsheets to properly capture the new source collection. While very unlikely – extremely unlikely if I didn’t point your attention toward it from the beginning — you may notice some different defensive scheme percentages, moving forward. Please allow me the opportunity to prove that the change will be to the benefit of our DFS success, beginning right away in Week 10.
QB Matchups to Target
Justin Fields, CHI ($6.5K DK | $8.3K FD) vs. Lions’ Cover 1 | 2
Additional adjustments to the setup of this series begin this week with an extra focus toward tailoring leans to constructing competitive entries into the DK Milly Maker. Cash gamers have nothing to fear. Ownership percentage has never been built into this piece, while the ultimate goal of identifying maximum fantasy pointage will never diminish as the quintessential matchup kingpin. Every single life-changing, cash-collecting Milly Maker line identified, no worse than, the QB2 from the main slate as its foundation. Among the Milly-winning entries, no position has averaged more FPG (39.4), FPs/$1K of salary (6.07), or average FPs over floor (20.3). In addition, the only slots to see a higher cap percentage devotion than QB (13.8%) have narrowly been at RB1 (14.3%) and WR1 (14.2%). Another clear focus of our QB selection process should be in identifying the top Cover 1 matchups on the slate. Among the nine winning lines to date, seven (78%) had key matchups in common across from Cover 1 defenses. The next scheme success on the list has been Cover 3 – three-of-nine (33%), with Tua Tagovailoa in Week 2 as the only QB pairing Cover 1 exploits with those facing Cover 2.
We have a new frontrunner in average ‘22 FPG on the ground from a QB after Week 9 play. It’s not Jalen Hurts, Lamar Jackson, or Josh Allen. Justin Fields takes over the honor after generating his 15-178-1 rushing line and 45.7/42.7 FPs. No reason to mince words in stating that not seeing a Cover 1-heavy opponent on the schedule across from Soldier Fields is not going to destroy his upside. However, we are not looking for upside with our choice, we want the closest to a guarantee that our cap money can buy. It just so happens that the Lions check that box for us. Detroit has put the fourth-highest rate of man coverage into play this season (40%). They have provided opposing offenses with the second-most FPG through nine weeks (101.3), fifth-most the last four (96.6) and the sixth-most over their last two games (104.0).
Aaron Glenn’s defense has dealt out the most total YPG (417.3), the most PPG (29.3), the highest third down conversion rate (51.0%), the fifth-most rushing YPC (5.0), second-most YPG on the ground (148.8), the highest passing first down rate (39.1%), fourth-highest passer rating (99.8) and the most passing YPA (7.84). Rushing 40 times for 252 yards in Week 9 only cemented the Bears’ standing as the premiere rushing attack in the league – 195.4 YPG. They are joined by the Browns, Ravens, Vikings, and Eagles as bringing a top-five run-blocking O-line with them each week. However, while the Chicago O-line has excelled when moving forward, asking them to step back to pass protect has lacked in quality returns. They permitted 67 total QB pressures between Weeks 4 and 7. That per-game average has been cut in half over the last two weeks.
Labeling the reason for success as “letting Fields run more” is inaccurate. Fields’ dropback average in those last two games (34.0) is actually higher than those previous four (33.3). It’s not due to an increase in designed runs, either – 6.0/game the last two, 4.0/game the previous four. The major difference has been Fields’ recognition of pressure and increased willingness to scramble away from collapsing pockets. Across the last two weeks, he’s scrambled away from pressure at an 82% higher rate (5.5/game), compared to those previous four (1.0/game). The resulting chunk yardage has also resulted in opposing defenses finding first-hand how dangerous it has become to send blitz packages at Fields. If anyone could somehow be unconvinced at the thought of Fields’ potentially adding a second-straight week as the QB1, consider that the Lions are seeing the second-most QB rushing attempts/game (5.5), yielding the fifth-most QB red zone (RZ) carries/game (1.1) and the fourth-most rushing FPG to QBs (4.31).
Tua Tagovailoa, MIA ($6.7K DK | $8.1K FD) vs. Browns’ Cover 1 | 4
No Joe Burrow. No Jalen Hurts. No Lamar Jackson. No Justin Herbert. We don’t even have Jimmy Garoppolo or Geno Smith on the main slate this week. Losing Seattle-Tampa Bay to foreign soil results in a second-straight week with only 10 games on the main slate. Fewer games do not equate to depressed expectations of competitive scoring after the Week 9 Milly max output (268.1 FPs) was the third-highest of the season. We have our work cut out for us, ladies and gentlemen. You know the old saying about failing to prepare, so buckle yourself in. It took six weeks for Tua Tagovailoa to make his league-leading second appearance on a Milly-winning line in Week 8. That was the same week that the Browns bottled Joe Burrow’s high-powered Bengals’ offense to only 232 passing yards. Not a problem.
Besides being without Ja’Marr Chase, Burrow completed 71.4% of his attempts and connected for multiple TDs. Cleveland has utilized the eighth-most Cover 1-heavy rotation (29%), supplemented by the ninth-highest Cover 4 rate (24%) under Joe Woods. Distributing the ninth-most overall FPG to opposing offenses (177.0), it may appear, at first glance, from the FPG allowances to QBs (12th-fewest at 15.1) that we should avoid this matchup. Always rubberneck your gaze around first appearances. Opposing QBs have averaged the fewest passing attempts/game (30.1) against the Browns. However, QBs have actually fabricated the 12th-most FPs/passing attempt when facing the Dog Pound (0.41). That lack of attempts is due to Cleveland handing out the fifth-most ground FPG to RBs (17.6). We already saw the result of Miami facing the worst run defense in the NFL, which resulted in their passing rate (62%) only slightly dipping from their season average (64%). Oh yeah, that example also took place in Week, Tagovailoa’s second Milly-making appearance.
The Browns are permitting the 10th-highest passing YPA (6.88), eighth-highest passing TD rate (0.84%), the most RZ touches/game (6.0) and 12th-highest passer rating (93.2). Tua has the hottest arm on the planet. He leads all QBs with 0.58 FPs/dropback (FP/Db) and, despite missing the entire second half in Week 4, ranks fourth-best in DK and FD FPG (21.2/20.0). He also continues to pace all QBs in average FPG rank across from being blitzed, not being blitzed, pressured and from a clean pocket. There are three QBs on the main slate that I view as candidates to pace the position in FPG, Fields and Tagovailoa have already been covered. The third, Patrick Mahomes, comes with QB2/QB2 pricing.
Andy Dalton, NO ($5.5K DK | $6.8K FD) vs. Steelers’ Cover 1 | 2
Andy Dalton may not be in the running for a spot in my implied top-three for the most FPs in Week 10, but his QB14/QB14 pricing could still leave him in the running for enough FPs of profit over his floor to compete in the Milly Maker. The lowest FP profit from a winning QB this season has been 13.6. Adding that number to Dalton’s pricing floors (16.5/17/0) tells us that we will need at least 30.1/30.6 FPs from Andy to compete. Dalton gave his best game of the season when he assembled 32.5/29.5 FPs in Week 7 at Arizona. It was a Cardinals defense fielding the 10th-highest rate of Cover 2 schemes. In addition to supplying the second-highest rate of Cover 1 (35%), the Steelers are also dopingly featuring the ninth-highest rate of Cover 2 (20%).
Over the last three seasons, the Red Rocket has manufactured the ninth-highest improvement rate to his overall FPG average (15%) among 43 QB qualifiers facing Cover 1. He has also connected on 27% of his TD throws on 23% of his dropbacks over that stretch. By itself, the Cover 1 argument falls a bit shy. However, his Cover 2 success against a Cover 1 and Cover 2 defense grows strong, sexy legs. During the last three campaigns, Dalton leads all QBs with a 15% FPG growth rate, a 109.8 passer rating, and a 4.5% TD rate when teams dare defend him with Cover 2. Devote the most bankroll resources to Milly entries headlined by Fields and Tagovailoa, but be sure to toss a few into the mix with Mahomes and Dalton at the top.
Alternative Targets
Patrick Mahomes, KC ($7.9K DK | $8.5K FD) vs. Jaguars’ Cover 1 | 2
Jared Goff, DET ($5.5K DK | $7.2K FD) vs. Bears’ Cover 1 | 2 | 3
Kenny Pickett, PIT ($5.1K DK | $6.6K FD) vs. Saints’ Cover 1
QB Matchups to Avoid
Kirk Cousins, MIN ($6.0K DK | $7.3K FD) vs. Bills’ Cover 2 | 4
This is the second week in a row that Kirk Cousins holds the top spot on the avoid list. When Captain Kirk connected with Justin Jefferson for a nine-yard TD on their opening drive last week, 67 passing yards and the score did not appear to sit well with the Avoid suggestion. Kinda why at least four quarters make a game. His passing yardage per minute of play plummeted by 67% over the remainder of that game. His resulting FPG fell -1.2/-6.3 short of his floor and 22.0 short of Fields for QB1 honors. As had been explained, the Commanders had improved in defense of opposing FPG at a rate superior to every NFL team over the previous four weeks. Following another strong defensive showing against the Vikings, Washington currently ranks 17th-best in limiting their opponents to 81.0 total FPG.
Buffalo is the second-stingiest defense at restricting total FPG (72.0), 11% fewer than the Commanders. The Bills have closed off QB production to the third-fewest at 11.3, the fifth-lowest passer rating (76.4) and sixth-lowest passing YPA (5.97). The franchise named after gunslinger Buffalo Bill nearly prevented Zach Wilson from throwing for 150 yards last week (154). If not for their No. 1 working out of the slot (Garrett Wilson) where the Bills have struggled, they would have held Wilson to much less then 150. Consider the fact that one of their two most dominant coverage defenders (Matt Milano) didn’t even play last week. Milano is already practicing with sights set for a Week 10 return. If all that weren’t enough, Orchard Park will see snow showers on Sunday. This matchup is forecasted for the coldest game-time temperature (31℉), most frigid “feels like” temperature (21℉) and strongest winds of Week 10 (13 MPH).
Russell Wilson, DEN ($5.9K DK | $6.9K FD) vs. Titans’ Cover 2 | 4
Very little of your time will be sacrificed on this avoid suggestion. Bottom line, until Russell Wilson proves that his legs are healthy enough to take advantage of the mobility he displayed during his last fully healthy season (2020), he will continue to be removed from my board for DFS consideration. His rushing attempts/game are down 31% and his YPC has declined by 30%. Simply moving from DK Metcalf and Tyler Lockett to Jerry Jeudy and Courtland Sutton is a downgrade, in-and-of-itself; the offensive struggles from Denver this season make fading The Professor one of the easier Week 10 decisions.
Daniel Jones, NYG ($5.7K DK | $7.5K FD) vs. Texans’ Cover 2
One of the strongest explanations I can provide to explain my devotion to avoiding all outside analysis each week — or doing everything in my power to that end — is in keeping my process sterile to surrounding influences. While I do not have the projected ownership numbers in my hand by design, I am expecting a high percentage of the field will bite on exposure to Daniel Jones this week. The Texans are supporting the most rushing YPG to opposing offenses (180.6). The explanation for that generosity is in missing one-fifth of their tackling attempts, unsurprisingly the highest rate this season. However, try to explain how the previous two sentences can account for Houston only yielding 22.9 PPG (14th-fewest). Give up? Lovie Smith’s team has a massive amount of work to do in the tackling fundamentals department. That said, they are equipped with one of the up-and-coming secondaries in the NFL.
The Texans pack four extremely talented corners (Steven Nelson, Derek Stingley, Desmond King and Tavierre Thomas) and a promising rookie strong safety in coverage (Jalen Pitre). The pass rush is also fueled by Jerry Hughes and Rasheem Green as dangerous threats off the edges. But it’s two defining stats that should push everyone off Danny Dimes:
Houston ranks 14th in third-down conversion rate (41.2%).
Most of all, the Texans have held opposing QBs to the fourth-fewest rushing FPG (1.50).
Sifting through the noise to verify the viability of limiting opposing ground production from QBs, the facts support the numbers with previous ‘22 games against Justin Fields, Jalen Hurts, Malik Willis, and Russell Wilson. Lessons have already been learned from attacking the Houston secondary with our QB selections. Unlike the deal with the Browns, the Texans are countering the fifth-fewest passing attempts/game (31.0) by holding QBs to the seventh-fewest FPs/attempt (0.35). Easy fade.
Additional Avoids
Aaron Rodgers, GB ($5.8K DK | $6.7K FD) vs. Cowboys’ Cover 1 | 2
Ryan Tannehill, TEN ($5.2K DK | $6.7K FD) vs. Broncos’ Cover 6
Derek Carr, LV ($5.6K DK | $7.1K FD) vs. Colts’ Cover 3
WR1 Matchups to Target
Amon-Ra St. Brown, DET ($6.9K DK | $6.9K FD) vs. Kyler Gordon, CHI
Let’s dig one level further into the depths of the specific WR types selected in the winning Milly Maker lines. The following table will supply the answers:
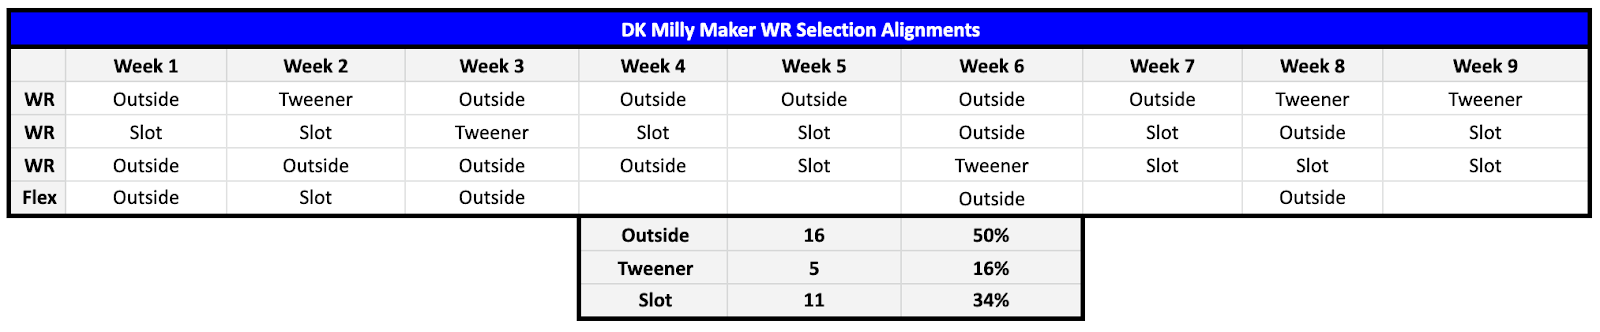
Tweeners such as Tyreek Hill and Allen Lazard provide us with little in the way of authenticating much of anything. However, learning that 11 slot wideouts have graced winning entries is considerable. Offenses obviously use two WRs on the outside, but only one dedicated to aligning on the interior. A 34% hit rate on slot WRs vs. 25% from the perimeter (50% ÷ two), more than anything, informs us that we do not need to limit our WR selections to specific alignment tendencies. It may come as a bit of a surprise to learn that Amon-Ra St. Brown has actually employed a 55:45 snap split between the sideline and interior. A bit of that is misleading since his actual route split is 65:35 in favor of the slot. The injury issues with Detroit’s wideouts will likely push a good amount of that split for ARSB back inside once Jameson Williams and DJ Chark finally retake the field. Either way, his Week 10 matchup cannot be overlooked.
The Bears are enforcing the field with the ninth-highest Cover 1 rate (29%) and 10th-highest of Cover 2 (18%). It’s a very high combined rate from a three-scheme rotation that leaves little to the imagination. The crown jewel of Detroit’s offense, the proof can be found in St. Brown still impressively ranked with the 15th-most targets/game (8.29) in spite of leaving two games early, one of them after only a handful of routes. Declaring a demise of ARSB’s top-five WR potential would be a big mistake. Averaging 11.7/8.9 FPG during his last two outings have been quite the disappointment. But we need more to fill in the blanks. In Week 8, the Lions entered the half with a 27-17 lead over Miami. Jared Goff built that margin on the heels of 25 passing attempts, seven to Amon-Ra for a 5-53-0 line at halftime. For whatever reason, first-year offensive coordinator Ben Johnson took his foot off the gas. Goff only attempted 12 passes the rest of the game, St. Brown was only fed with three additional targets, catching two for 16 yards. The seeds had been planted for so much more. As for Week 9, if you jumped on ARSB against Green Bay, you failed to heed my advice to avoid him with Rasul Douglas in coverage.
Week 10 is a clean slate. During his career, St. Brown has generated the 15th-most FPs/route (FP/Rt) with 0.52 across from Cover 1. He’s turned 18% of his routes into 25% of his TDs vs. single coverage. That would be worthy of WR2 consideration – particularly with his pricing down $800/$1.3K below his season highs – on its own. However, we also have that little Cover 2 detail. ARSB leads the planet with both a 31% target/route rate and 0.54 FP/Rt across from Cover 2. It was the scheme that hit first for St. Brown during his rookie season. That’s quite enough for our WR1, right? I demand more.
The Bears have been just under seven times (85%) more vulnerable to production from slot WRs than on the perimeter. What a coincidence? Chicago nickelback Kyler Gordon has been the most victimized participant among the 40 qualifiers at his position. The rookie out of Washington was flagged for not being physical enough during the draft process, resulting in falling outside of the first round. Not an issue you want to bring into a matchup with one of the, pound-for-pound, most physical receivers in the game. To date, Gordon is supplying his coverage with the most yardage/coverage snap (YPCS, 1.90), the ninth-highest targeted passer rating (TPR, 113.8), third-most FPs allowed/coverage snap (0.38) and responsible for the most FPG (12.2). Yes, now we can rest our case in favor of St. Brown as an elite WR1 in Week 10 and with pricing low enough to target as a WR2.
Jaylen Waddle, MIA ($7.6K DK | $8.2K FD) vs. Denzel Ward, CLE
Nobody with Milly Maker entries worth their entry fees needs to be introduced to Tyreek Hill. It can also be assumed that 99+% are fully indoctrinated with Jaylen Waddle’s goodness. The dynamic duo has made an incredible seven combined appearances on Milly-winning lines through nine weeks. What separates the two? Specifically, 3.4 targets,/game, 3.2 receptions/game and 32.5 YPG in favor of Hill. Keep in mind that Hill also leads the NFL in YPG (122.7) and yardage gained/route (YPRR, 3.82), while he’s second in targets/game (11.0), target/route rate (31%) and air YPG (130.9). None of the nine conquering Milly lines have done so with a player priced at $9K-or-more but, if any player is going to break that streak, it’s likely to be either Cheetah or Cooper Kupp.
Waddle may not see the lion’s share of the targeting, but he’s flipped the 33rd-highest target share and 31st-highest air target share (86.9) into the sixth-most YPG (90.2) and seventh-most FPG on both platforms (19.7/15.6). Hill is pacing everyone with 0.70 FP/Rt, Waddle is fifth-best with 0.56. The Waddle celebration is also on display far more frequently than we see Cheetah cross the goal line – 12.8% TD rate for Waddle, 3.9% for Hill. The alignment numbers also paint a more difficult matchup for Hill when he’s outside (Martin Emerson) or in the slot (Greg Newsome). Will they shut him down? No way in hell. However, Waddle is going to work opposite Denzel Ward in his return from a two-game absence due to a concussion.
Prior to the injury, Ward significantly struggled in controlling his responsibilities. Among 89 qualified outside corners, Ward supplied 1.81 YPCS (seventh-most), 0.10 air yards/coverage snap (AY/CS, 10th-most), the 17th-most FPG (10.26) and 16th-most FP/CS (0.18). Cleveland has supplied top-three WR production to outside wideouts this season. Go take a look at the schedule Cleveland has faced. Remembering to remove Ja’Marr Chase and Keenan Allen from the list, the Browns have played one of the most watered-down WR schedules in the league this season. They are about to face one of the two-or-three best WR duos in the game. There’s zero reason to waste anyone’s time spelling out the Cover 1 and 4 success from Waddle. Bottom line: it’s a beastly spot for both of Miami’s receivers. And we get a $1.5K discount off Hill’s pricing to roster the wideout that’s already been found on four Milly-winning lines.
CeeDee Lamb, DAL ($7.0K DK | $7.6K FD) vs. Keisean Nixon, GB
CeeDee Lamb appeared headed toward dedicated coverage from Rasul Douglas this week. That all changed toward the end of the third quarter in Week 9 when Eric Stokes was injured, possibly ending his season. Douglas is now a threat to outside WRs. In his place, Green Bay will attempt to move forward with 2019 UDFA Keisean Nixon on the interior. The early results are concerning. Nixon is allowing the eighth-most YPCS (1.39), seventh-most AY/CS (0.07) and 12th-most FP/CS (0.29) among 41 qualified nickelbacks.
Joe Barry already removed Nixon from the rotation due to poor results after a two-week stint of significant reps back in Weeks 3 and 4. Barry will now keep his fingers crossed that Nixon can contain one of the top-five interior WRs in the world. The Packers are running out the sixth-highest rate of Cover 1. Dak Prescott has assembled the sixth-most FP/Db (0.52), sixth-highest passer rating (108.8), and third-highest TD rate (11.4%) when working against Cover 1 the last three years. The overwhelming matchups on tap for Michael Gallup and Noah Brown will be covered below. Prescott will either need to pepper Lamb facing a UDFA, Dalton Schultz or his RBs to produce in Week 10. My literal money will be on Lamb eating a buffet to justify our WR1 attention.
Chris Olave, NO ($6.8K DK | $7.5K FD) vs. Levi Wallace, PIT
Are we really going to trust a rookie with our WR1 responsibilities in the Milly this week? The only rookie wideout to land on a winning entry this season was all of the way back in Week 1. Romeo Doubs entered the season with $3K pricing, but the lineup still succeeded in spite of Doubs falling -0.2 FPs under his floor. Yeah, not the greatest example to build trust in Chris Olave. Until the last two weeks, Olave had a three-game when-healthy streak of hitting profit when he hit 16.9 FPs of profit, 5.63/game, in Weeks 3, 4 and 7. It’s already been outlined that we need a bit more than Olave’s career-high of 26.7 FPs from our WR1. We also need in excess of 5.63 FPs of profit from each of our WR slots to compete in the Milly. Let’s see if a deeper peek points us closer to or further away from Olave.
The Dalton analysis already explained the Cover 1 and 2 setup from Pittsburgh. We definitely need a much more significant sample size from the rookie before we see him qualify for rankings. However, what we have is truly eye-opening. Across from Cover 1, he’s been targeted on 45% of his routes against Cover 1. If qualified, his 0.55 FP/Rt and 19.8 air YPT would both land inside the top-10. Olave has only scored two career TDs, but he collected one of those (50%) on only 19% of his career routes. Olave’s efforts working through Cover 2 are much the same. If they qualified, his 3.19 YPRR, 25.5 air YPT, 25.5 YPR and 0.44 FP/Rt would each rank inside the top-10.
Pittsburgh has been decimated by passing offenses for the second-most YPG (277.3), second-most YPA (7.47), second-most TD/game (2.0), the highest TD rate (1.10%) and 10th-highest passer rating (93.4). The fact that they have provided opposing WRs the most YPG (212.9), the most TD/game (1.63) and the most FPG (45.) certainly support devoting attention toward Olave. Ahkello Witherspoon and William Jackson have yet to practice this week, so it must be assumed that they will not play. That leaves Levi Wallace over Olave. He’s been tattooed for the ninth-most YPCS (1.75) and 14th-most FP/CS (0.32). We end up with more than enough reasons to justify exposure to Olave in the WR1-2 range. Losing Michael Thomas for the season should land Olave a massive target share the rest of the way. This is a matchup of nuclear potential for both Dalton and his rookie No. 1.
WR2 Targets
Amari Cooper, CLE ($6.5K DK | $7.8K FD) vs. Xavien Howard, MIA
Gabe Davis, BUF ($6.4K DK | $6.5K FD) vs. Akayleb Evans, MIN
JuJu Smith-Schuster, KC ($6.0K DK | $7.0K FD) vs. Montaric Brown, JAX
Christian Kirk, JAX ($5.9K DK | $6.8K FD) vs. L'Jarius Sneed, KC
WR3 Targets
Darnell Mooney, CHI ($5.5K DK | $6.2K FD) vs. Will Harris, DET
Rondale Moore, ARI ($5.2K DK | $5.8K FD) vs. Troy Hill, LAR
George Pickens, PIT ($5.0K DK | $5.6K FD) vs. Paulson Adebo, NO
Robbie Anderson, ARI ($3.2K DK | $4.9K FD) vs. Derion Kendrick, LAR
WR Matchups to Avoid
Justin Jefferson, MIN ($8.8K DK | $8.6K FD) vs. Dane Jackson, BUF
Pushing out avoid opinions on top-five wideouts has the potential to result in seeing a 10-146-2 line staring you in the face. That was the case last week with Davante Adams. It could have reached epic fail proportions if Adams actually caught any of his eight targets during the second half. At least we didn’t see Adams populating the Milly Maker. And that is the exact issue presented to us when we invest in $8K-or-more WRs. We need to see an average of at least four FPs/$1K of salary invested to compete in the Milly. That number can be lower in some slots, but we will need to make up for that deficiency in others.
Justin Jefferson is priced as the WR3/WR4. Our needs go above-and-beyond JJ’s floor requirements of 26.4/21.5 FPs. We will need Jefferson to go for 35.2/34.4 to hit the required ratio for relevant Milly output. Jefferson hit 42.4/34.9 back in Week 1. He also landed on the winning line that week. We know he’s capable of that type of output when the matchup is right. This is not going to be one of those weeks. His first challenge will be in overcoming the snow and wind. Then he’ll need to go crazy on a defense specifically built to keep receivers from going crazy (Cover 2 and 4). Dane Jackson will work opposite Jefferson the most. He has held his responsibilities to the 17th-fewest YPCS (0.73), 15th-lowest TPR (65.5) and 16th-fewest FP/CS (0.15). The evidence points considerably against investing in Jefferson for Milly purposes.
Michael Pittman, IND ($6.2K DK | $6.3K FD) vs. Anthony Averett, LV
All things being equal, Michael Pittman is one of the top-20 most talented WRs in the NFL. Equal left the stadium when Sam Ehlinger entered the lineup. Ehlinger offers Pittman the target share he deserves, but his live-game NFL experience is nearly non-existent and his abilities were not suited for this level dating all of the way back to Texas days. There is no other position in football where a complete flipping of one’s play from worthless to startable, seemingly overnight, can occur than at QB. However, we see the vast majority of those improvements made during collegiate careers. You can likely count the examples on one hand of these types of miraculous transformations taking place on an NFL field. When Indianapolis is facing a poor run defense, its starting RB, like the rest of the league’s franchises, holds value. Until the day comes that Ehlinger starts playing like an NFL QB, every single sentient presence in the passing game must be faded. Yes, even when facing the Raiders.
Courtland Sutton, DEN ($5.6K DK | $6.2K FD) vs. Kristian Fulton, TEN
At one point the Tennessee defense was a stepping stone for opposing passing offenses. On the other hand, the Titans have rocked a stout run defense all season. It’s not the only reason, but Kristian Fulton turning back into the caliber of a No. 1 corner that we saw glimpses of the last two seasons has been a significant factor in the defensive turnaround. Fulton’s play mirrored the issues with the Titans’ defense early in the year. He’s been so good of late that he’s pushing his metrics into top-25 territory. As it stands, Fulton is holding his assignments to the 26th-fewest YPCS (0.19), 33rd-lowest TPR (83.4), 11th-fewest AY/CS (0.03) and 28th-fewest FP/CS (0.19). He’ll look to improve those numbers further while facing Courtland Sutton this week.
The Titans rotate a melting pot of schemes, headlined by the 10th-highest of Cover 2 (18%) and 12th-highest of Cover 4 (22%). They utilize the eighth-highest rate of double-high safety shells (47.1%). Two-high safety setups are the bane of Sutton’s existence. He’s only managed 0.19 FP/Rt (18th-fewest among 96 qualifiers) across from Cover 2 the last three seasons. That’s a 42% decline in his overall average, the 14th-highest drop. In 179 routes against a Cover 2, Sutton has yet to find the end zone. Cover 4 has not been much better on Sutton’s numbers. He’s created the 37th-fewest FP/Rt (0.30) among 96 qualified and, once again, zero TDs over 147 routes the last three campaigns. The pricing for Sutton is nice. The matchup offers nothing that should approach any Milly line that actually anticipates competing.
Brandin Cooks, HOU ($5.3K DK | $6.1K FD) vs. Adoree Jackson, NYG
One might think that Brandin Cooks would be able to utilize his blazing 4.3-speed to do some damage against Cover 1. One would be incorrect. Cooks ranks 77th-best out of 106 qualifiers in FP/Rt when opposed by Cover 1 (0.29). It stands as the 10th-largest plummet to an overall FP/Rt average (-20%). Perhaps the craziest stat among the entire write-up, Cooks has scored zero TDs the last three seasons when the defense has put a Cover 1 on the field. It’s a stretch that includes exactly 400 scoreless routes from Houston’s WR1. The Giants depend on the third-highest rate of Cover 1 (35%). Adoree Jackson has been a touch more on the generous side than we are used to seeing but, overall, New York’s secondary has limited opposing WRs to the fifth-fewest FPG (27.7). Working across from Cooks should assist Jackson toward pushing his metrics back toward the top-25 numbers we’ve come to expect. Look elsewhere.
Additional Avoids
Michael Gallup, DAL ($4.9K DK | $5.7K FD) vs. Jaire Alexander, GB
Robert Woods, TEN ($4.9K DK | $5.6K FD) vs. Patrick Surtain, DEN
Josh Reynolds, DET ($4.6K DK | $5.7K FD) vs. Jaylon Johnson, CHI
Marquez Valdes-Scantling, KC ($4.1K DK | $5.4K FD) vs. Tyson Campbell, JAX
TE Matchups to Target
Cole Kmet, CHI ($3.4K DK | $5.3K FD) vs. Alex Anzalone, DET
Once Justin Fields inserted doubt into opposing defensive coordinator’s decisions on whether or not to blitz his pocket, the field opened up for the Chicago passing game. We’ve only seen a handful of QBs in the history of the game with Fields’ combination of size, speed, and awareness to avoid contact at all costs. No matter how much the passing game opens up for the Bears, it would be unwise to expect Fields to slow his ground exploits any time soon. That’s not an issue at all for Cole Kmet. If he were at the point in his career where he drew a 10-plus target average, we’d be paying far more of our cap to secure his services.
The Milly lines taking down the top prize averaged a $2.9K investment into their TE. That’s the ballpark of each of the four TE targets you see before you. Kmet countered his first TD in Week 8 by taking two into color last week. He even got into the fun on the ground with a pair of carries and nine rushing yards. The more touches the better. The overwhelming factor we need to consider a TE is FPG hemorrhaging toward the position. The Lions have supplied opposing TEs with the sixth-most reception/game (5.63), fifth-most YPG (62.8), fourth-most TDs/game (0.63) and fourth-most FPG (15.7). The Kmet Train is leaving the station, jump on or it’ll leave you behind.
Greg Dulcich, DEN ($3.4K DK | $5.9K FD) vs. David Long, TEN
When I met Greg Dulcich at the Combine, he did not present himself as entitled. He took the time to chat with me, kindly answered all of my off-camera questions and even made it a point to acknowledge me every time we crossed paths the rest of that weekend. My experiences at the Combine opened my eyes to a new world of important behavioral factors that NFL teams use to evaluate talent. Prior to my time in Indianapolis, the very idea of temperament impacting an NFL career seemed silly. If you trust my opinion, then know that a player’s mental stability is an essential trait toward a successful career.
All of that to pass along that it’s not even a slight revelation seeing Dulcich hit the ground running with the Broncos. He went from never playing a down to scoring the fourth-most FPG on both platforms (12.1/10.1) after 93 career routes. His last two games saw Dulcich collect 20% and 21% target shares, while his route percentage jumped from 64% to 91%. The sweet spot at TE is 20% and 80%. It would seem that Dulcich could have both locked down. As for the matchup with Tennessee, the one hole within their defensive improvements is in containing opposing TEs. Leveraged by the eighth-most targets/game (8.6), Tennessee is authorizing the fourth-most receptions/game (6.0), third-most YPG (69.9), ninth-most TDs/game (0.50), and third-most FPG (16.0).
If we get anything over 17 FPs from either Kmet or Dulcich, we’ll hit that beautiful 5.0 FPs/$1K of salary invested zone. Both will play in matchups where that type of production is completely possible.
Alternative Targets
Dalton Schultz, DAL ($3.8K DK | $5.5K FD) vs. Krys Barnes, GB
Tyler Higbee, LAR ($3.6K DK | $6.0K FD) vs. Isaiah Simmons, ARI
TE Matchups to Avoid
T.J. Hockenson, MIN ($5.3K DK | $6.0K FD) vs. Matt Milano, BUF
The Jets failed to take advantage of the absence of Matt Milano by targeting their TEs with volume last week. They scored the victory and did so by pushing the ball down the field on the ground, without Breece Hall. Nobody in New York is complaining. Milano is back in the mix this week. If the two of you have yet to be introduced, allow me the honors. Milano may already be the top coverage LB in the NFL. Ghosting his coverage to the lowest TPR (55.2) is a pretty big checkmark in favor of that assessment. Prior to the oblique injury that forced him out last week, Milano was also a force in run defense. His presence is going to be to the detriment of Minnesota, more specifically T.J. Hockenson, this week.
Milano has allowed four receptions of 10+ yards this season. He’s also turned targeting against him into a pair of INTs and three pass breakups. That’s not what anyone would consider an equitable trade-off. Buffalo’s defense has yet to permit a TD to a TE this season – a stat they share with the Jets. Overall, the Bills have only supplied an average of 9.8 FPG to opposing TEs. Restricting the position to a single target in a goal-to-go situation goes a long way to explain their success. Hock requires a WR2-level cap investment in what is likely to be his most challenging matchup of the season.
Pat Freiermuth, PIT ($4.2K DK | $5.6K FD) vs. Demario Davis, NO
There are only 20 teams on a main slate that does not include Mark Andrews, Kyle Pitts, Dallas Goedert, George Kittle, or Gerald Everett. One might assume that the top-five talents of Hockenson and Pat Freiermuth would take on premium importance. Once again, one would be incorrect. The issues on defense for New Orleans have been considerable this season. The absence of Marshon Lattimore is rumored to potentially extend several (more) games, paired with Bradley Roby landing on IR to define their unfortunate circumstances. The Saints have been very fortunate to see their second-round rookie out of Tennessee, Alontae Taylor, step right up for the club to stabilize one corner position.
The Saints were gifted with one of the top free-agent signings in team history back in 2018 when the Jets snoozed on Demario Davis. The three-year, $24 million contract with only $16 million in guaranteed money is laughable by today’s standards. It would seem to be quite a discount cash investment for, arguably, the top LB in the NFL. However, Davis just re-signed on another three-year pact with New Orleans at $27 million. The Saints were only required to increase the guaranteed money by $2.4 million. They are paying at the very least one of the top-three MIKE ‘backers LB10 dollars. It’s clear Davis values playing for a franchise that treats him as though he’s a part of the family.
No disrespect intended toward the Saints, but making a player feel at home is not a difficult ask when said player is shutting down his coverage responsibilities to 0.39 YPCS (fourth-fewest), 0.009 AY/CS (fifth-fewest) and 0.08 FP/CS (the fewest among 80 qualified LBs). Freiermuth is one of the most talented TEs in the league. It’s taken him all of 24 games to enter the top-five. Trading away Chase Claypool will open additional targets for Baby Gronk. Just don’t invest in Freiermuth turning his targeting into anything Milly-worthy with Davis patrolling the intermediate depths where Freiermuth thrives.


