Hello, and welcome to the Week 6 XFP Report. If you’re unfamiliar with XFP, I’ll get to that in a little bit.
But basically, every week we’re going to be telling you which players are seeing the best volume for fantasy, as measured by Expected Fantasy Points (XFP). We’ll be telling you who the best buy-low and sell-high candidates are, as measured by Points Above Replacement (PAR), or the differential between actual- and expected fantasy points. This is an especially effective approach in DFS, where players are typically priced by production rather than volume, though PAR will regress to the mean. And (at the end of the article) we’re going to be telling you who the best volume-per-dollar DFS plays are.
What is XFP?
Premium subscribers can access XFP (and other advanced stats like air yards, deep targets, end zone targets) here.
Expected fantasy points (XFP) is flat-out the best and most comprehensive way of measuring a player’s volume. It’s telling you – based on a player’s unique usage – how many fantasy points that player should have scored. It’s telling you how many fantasy points a perfectly league-average RB, WR, or TE would have scored with that same exact volume. It looks at every individual carry by down and distance and distance from the end zone and every individual target by depth of target and distance from the end zone, and then cross-references each carry and target to each carry and target with those specific qualifiers over a multi-year sample to tell you what exactly those carries and targets are worth (historically).
Expected touchdowns (XTD), same thing. RBs score from the one-yard line on 54% of their attempts. RBs score from the 17-yard line only 3.6% of the time. So why ever use “red zone carries,” which treats both carries the same, as a fantasy stat? I have no idea.
Why doesn’t everyone point to XFP in their fantasy research? I have no idea. Once you have XFP and XTD you can contrast that with a player’s actual fantasy points or actual touchdown total to tell you how efficient a player has been (PAR). This is especially useful in highlighting regression candidates, buy-low targets, and mispriced players for DFS.
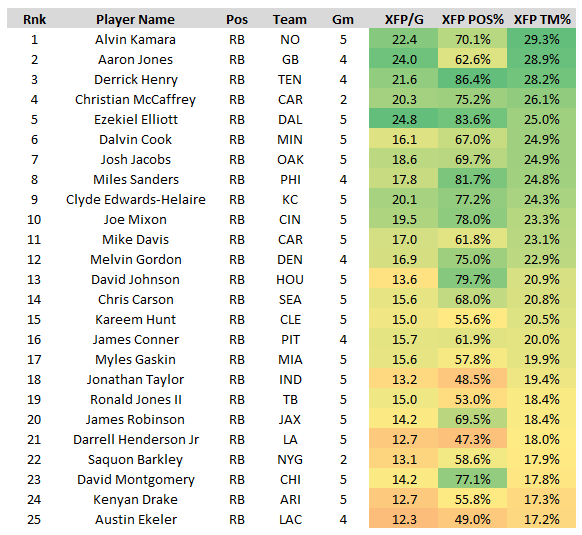
Through three weeks of action, here are the top-25 players in expected fantasy points (XFP) per game:
The Top-25
Featured Player
D.K. Metcalf, WR, Seattle Seahawks
XFP: 15.4, PPR: 20.3, PAR: +4.9
In Week 2, the league’s best CB Stephon Gilmore shadowed Metcalf on 88% of his routes, but Metcalf still walked away with a 4-92-1 line (on 6 targets), with all of that coming against Gilmore’s coverage. This was the 2nd-most fantasy points Gilmore has ever allowed to an individual WR in any game of his career. Immediately my head flooded with the possibilities of greatness. So, I turned to one of my go-to tape experts (Brett Whitefield), and asked two questions: 1) “Is Metcalf a league-winner?” 2) “Is Metcalf this team’s true WR1?”
Whitefield mostly answered in the affirmative, while also adding something I thought to be peculiar at the time. He said Metcalf might have the highest floor of any fantasy WR outside of maybe Michael Thomas and Davante Adams. I thought this to be strange, because (in fitting with his XFP profile) I was viewing Metcalf as more of a boom-or-bust option, but one that would go “nuclear” in those “boom” games. Here’s the full quote:
“Other than the Seahawks outright destroying an opponent, I see no other legitimate reason DK Metcalf should ever leave a game with less than 100 yards. With the skill set and physical profile he brings to the table and the way defenses are forced to play I see no reason the Seahawks can't get 100 yards a week out of him.”
Through 5 games, that quote looks prescient – Metcalf is averaging 1.0 touchdowns per game and has reached at least 90 yards in every game thus far.
And is he the team’s true WR1? He might be. Over the past two weeks he ranks 4th among all WRs in XFP per game (21.0) while Lockett ranks 66th (8.0).
The only concern with Metcalf would be a PAR of +4.9, which ranks 5th-most, and implies a significant regression to the mean. Still, I’m not too worried. WR efficiency is largely a product of QB efficiency, and Russell Wilson is probably the most-efficient QB in the league. Further, Seattle WRs have a long history of sustained hyper-efficiency – since 2015, a Seattle WR accounted for 3 of the top-10 fantasy points per target seasons and 4 of the top-10 seasons by PAR. No other team ranks in the top-10 more than once.
Just for fun, here’s another very prescient quote, this time from the best film analyst in the game:
“Given Metcalf’s overall traits profile, is it unreasonable to ask whether he can develop into a Julio Jones kind of receiver with more experience and more fully dimensional utilization?” -- Greg Cosell (June 2020)
Regression Alert
Clyde Edwards-Helaire, RB, Kansas City Chiefs
XFP: 20.1, PPR: 14.9, PAR: -5.2
Ladies and gentlemen, he’s doubling down!
Edwards-Helaire is far and away your hottest buy-low candidate, and our top regression candidate this week.
Edwards-Helaire ranks 2nd in XFP (20.1 XFP per game), 7th in rushing attempts (16.2 per game), and 4th in targets (5.4 per game). He’s seeing elite usage, but ranks just 20th in FPG (14.9). That’s bound to regress in a big way.
The concern with Edwards-Helaire is that he’s scored just one touchdown all year, despite an XTD of 4.87. He’s failed to find the end zone on all 10 of his opportunities inside the 10-yard-line, and maybe worse yet, he’s been held to just one opportunity inside the 10- in each of his last two games, though Kansas City totals 14 plays inside the 10- over this span. But here’s why I’m not worried – Edwards-Helaire ranks second among RBs in Red Zone Snap% (86%). He’s not seeing a ton of usage near the end zone (at least not in recent weeks), but at least he’s on the field for those plays.
Look for a massive regression to the mean from Edwards-Helaire, and especially in the touchdown department, on a team that could lead the league in offensive touchdowns scored at the end of the year. He’s seeing mid- to high-end RB1 usage, and I still have faith he finishes as a mid- or high-end RB1 at the end of the year.
Note: It’s come to my attention that it seems very likely RB Le’Veon Bell signs with Kansas City within the next 24 hours. If that happens, please disregard everything outlined above. And if you need me, I’ll be in my bedroom quietly sobbing.
Joe Mixon, RB, Cincinnati Bengals
XFP: 19.5, PPR: 17.3, PAR: -2.2
Is Mixon finally officially a bell cow? I think so. Across his last two games – one with very good game script (an 8-point victory), one with very bad game script (a 24-point loss) – Mixon is averaging 25.1 XFP, 24.5 carries, and 7.0 targets on an 80% snap share. For perspective, those numbers rank first, first, second, and third-best over this span. However, even after his big Week 4, he’s still a massive regression candidate and a glaring trade target – his volume is much better than his production implies, and maybe your leaguemates aren’t aware of that fact.
Mixon now ranks 3rd among all players in total XFP, but just 20th in total fantasy points. He looks boom-or-bust on paper, but he’s one of just 3 players to reach at least 15.0 XFP in each of the last 4 weeks. I assure you, he's going to bounce-back in a big way soon, but maybe not this week, as 9.5-point underdogs against a Colts defense that ranks 3rd-best in FPG allowed to opposing RBs.
A.J. Green, WR, Cincinnati Bengals
XFP: 12.3, PPR: 5.2, PAR: -7.1
When working with PAR, there’s always a delicate balance between “okay, buy-low now, this player’s volume is great and he’s bound to regress to the mean” and “this player is seeing very good volume, but he's not doing anything with it, and might just be bad.” In this instance, it’s not so delicate – it’s quite easy, in fact. Green is far more a “trap” than “a value.”
Through 5 weeks, Green ranks second in end zone targets (6), 4th in deep targets (10), 10th in air yards (490), 10th in XTD (2.4), 20th in XFP (61.3), and 21st in targets (34). Basically, with this volume, we should expect a perfectly average WR with a perfectly average QB to be putting up low-end WR2 numbers. Instead, he’s fallen a league-high 35.4 fantasy points below his expectation, averaging a lowly 5.2 FPG.
The easy tell here is that volume has totally fallen off of a cliff. He averaged 21.0 XFP per game through his first two weeks of the season, but averages just 6.5 since Week 3. Over this span, Green ranks 86th in XFP per game (6.5), while Tee Higgins ranks 17th (14.8) and Tyler Boyd (13.9) ranks 22nd. Basically, at age 32, and after a year-and-a-half away from football, Green looks cooked, and HC Zac Taylor and QB Joe Burrow seem well aware of it. He’s closer to someone you should leave on waivers, rather than look to “buy low”.
Chase Claypool, WR, Pittsburgh Steelers
XFP: 10.2, PPR: 17.6, PAR: +7.4
Like with what we just said with regard to Green, the reverse is true as well with a very high (rather than very low) PAR – “Okay, this player is racking up a ton of fantasy points, but his volume really hasn’t been anywhere as good, so sell-high now before the regression hits” vs. “This player really might just be really freaking good.” The tell for Claypool is the same for Green’s, again we’re looking for an increase or decrease in volume.
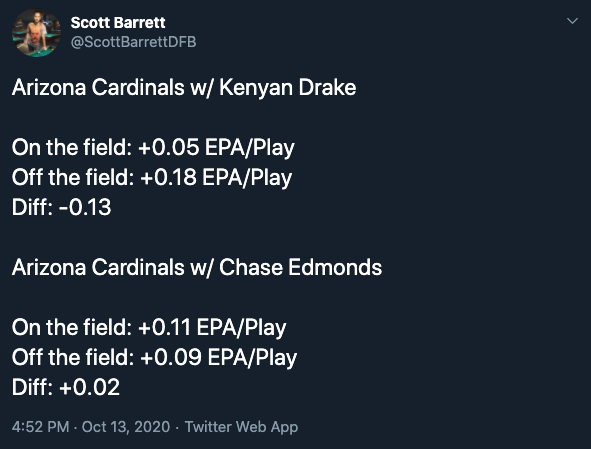
Kenyan Drake has fallen 11.8 fantasy points below his expectation, is he a buy-low candidate? I don’t think so. Instead, I worry that his poor efficiency might clear a path for Chase Edmonds to reach RB1 status – Edmonds has exceeded his expectation by 8.1 fantasy points. So again, we really want to be chasing volume, and then looking at efficiency as it relates to projecting future volume.
Claypool’s fantasy production is a whopping 1.7X his volume-based expectation. That’s insane. And due for a massive regression. But then again, he’s been so good that it’s hard to imagine this hyper-efficiency doesn’t result in increased usage. And in Week 5, his volume was excellent, ranking 3rd among WRs in XFP (26.7) earning 12 targets, 3 deep targets, 3 opportunities inside the 10-yard-line, 3 carries, and a 1.5 XTD. If Diontae Johnson sits out this week, Claypool needs to be ranked as a mid-WR2 at-worst. And even if he plays, it’s hard for me to imagine he doesn’t immediately supplant James Washington as the team’s WR3. JuJu Smith-Schuster on the other hand, is someone I’d be looking to sell. He ranks 26th in FPG (15.0), but just 60th in XFP per game (9.7).
Logan Thomas, TE, Washington Football Team
XFP: 11.0, PPR: 6.1, PAR: -4.9
Among all TEs, Thomas ranks 2nd in Route% (89%), 7th in targets per game (6.4), and 9th in XFP per game (11.0). And yet, he ranks just 35th in FPG (6.1). Again, like with Green, I think we call it – Thomas just isn’t very good. Maybe he’ll regress to the mean, but I think it’s more likely his mean is just well below the league average tight end.
Raheem Mostert, RB, San Francisco 49ers
XFP: 11.1, PPR: 23.7, PAR: +12.5
Conversely, what about Mostert? He’s more than doubling his XFP this year. There’s no way that’s sustainable right?
Like with Seattle WRs, we have a long history of sustained hyper-efficiency from Shanahan RBs, including Mostert, who posted an all-time season last year, out-scoring his XFP by 1.7X. And, believe it or not, he actually leads all RBs all-time in career YPC (6.17).
Adjusting for the fact that he missed the entirety of the second half in Week 2, but not the fact that he was limited in last week’s game, Mostert is averaging an astonishing 13.6 carries, 4.0 targets, 150.8 scrimmage yards, and 23.5 fantasy points per four quarters this year. His PAR may suggest you “sell-high”, but I’d argue for the opposite – send out some trade offers and see if you can’t acquire him for less than he’s worth (high-end RB2).
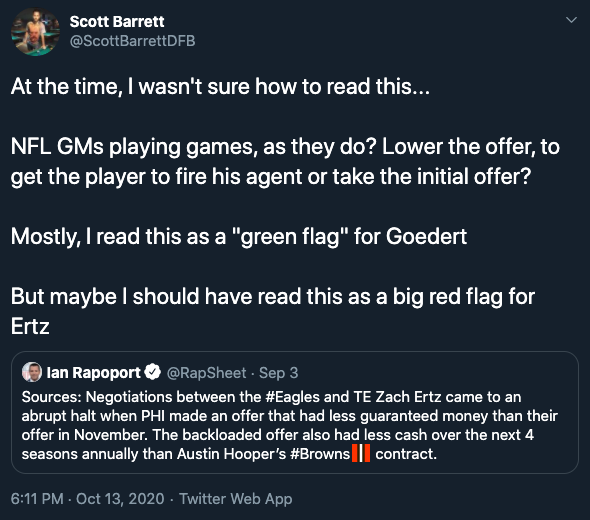
Zach Ertz, TE, Philadelphia Eagles
XFP: 11.3, PPR: 8.1, PAR: -3.2
Like many of the names we’ve discussed thus far, Ertz is a difficult but important case study in PAR. Ertz has fallen 15.9 fantasy points behind his expectation. He ranks 7th in XFP per game (11.3) on a 89% route share (4th-best), but ranks just 24th in FPG (8.1). That’s in spite of the fact that Philadelphia has been down 3 starting WRs and a TE for multiple weeks. At age 29 (30 next month), is it possible that he’s already in the decline phase of his career?
Through the first 5 weeks of the 2020 season, Ertz is averaging just 8.5 FPG on 7.0 targets per game. Over his prior 7 games (to end the 2019 season), Ertz averaged 18.6 FPG on 10.1 targets per game.
All-in-all I’m optimistic he rebounds, but cautiously so. I have a hard time imagining he doesn’t finish the season as a low-end TE1, but I also no longer think a top-5 finish is within his range of outcomes.
Volume Chasing
CeeDee Lamb, WR, Dallas Cowboys
XFP: 16.2, PPR: 17.1, PAR: +0.9
CeeDee Lamb? More like CeeDee Goat, amirite?
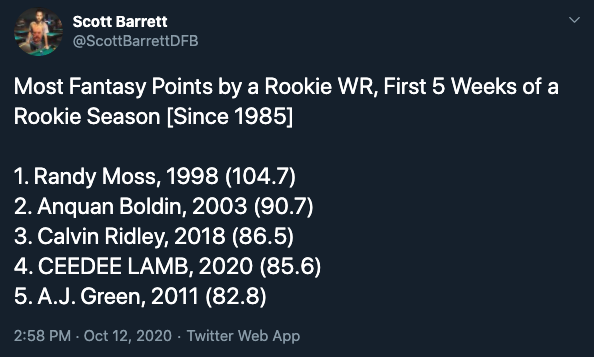
Since Week 2, Lamb ranks 4th among all WRs in XFP Per game (17.6), ahead of Amari Cooper (16.3) and Michael Gallup (16.3). And he’s been quite productive on this good volume, scoring 20.5, 11.6, 25.2, and 23.4 DK fantasy points in each of these games. Dak Prescott’s season-ending injury could throw a wrench into this situation, but I’m still starting Lamb with confidence as (at worst) a low-end WR2 this week.
Allen Robinson, WR, Chicago Bears
XFP: 19.3, PPR: 17.8, PAR: -1.5
Allen Robinson has seen at least 8 targets in each of his last 11 games (averaging 11.4 per game), while also averaging 18.7 FPG over this stretch. Better yet, over the last three weeks (coinciding with the benching of Mitchell Trubisky), Robinson has seen 13, 10, and 16 targets, totaling 28.3, 23.1, and 19.0 fantasy points. Over this span, Robinson ranks 1st in XFP (64.7, 21.6 per game), 1st in fantasy points (70.4, 23.5 per game), 1st in targets (39, by +8), 3rd in end zone targets (4), and 5th in air yards (364).
Mike Davis, RB, Carolina Panthers
XFP: 17.1, PPR: 18.2, PAR: +1.1
Mike Davis is averaging a league-high 23.9 XFP per game since Week 3. Or since Christian McCaffrey’s injury in the 4th quarter of Week 2, 26.2 XFP per four quarters. Any way you slice it up, it’s unreal usage, comparable only to maybe Christian McCaffrey’s 2019 season. If McCaffrey sits out again this week, you’re starting him as a high-end RB1.
Myles Gaskin, RB, Miami Dolphins
XFP: 16.4, PPR: 13.7, PAR: -2.7
Gaskin totaled 25.4 XFP in Week 5, which ranked 3rd-most on the week, and represented a season-high for him. I don’t think it was uncoincidental that this came in a week Jordan Howard was ruled as a healthy inactive. Despite averaging just 4.5 carries per game, Howard was averaging 0.99 XTD per game (4th-most), serving as the team’s goal-line back. In Week 5, that role went to Gaskins, who saw all 5 of the team’s 5 opportunities inside the 5-yard-line. Through the first 4 weeks, Gaskin averaged 14.1 XFP per game (17th-most), earning just 53% of the team’s XFP out of the backfield. In Week 5, that shot up to 77%. If that was the case throughout the full season (77% of Miami’s backfield going to Gaskin), he’d be averaging 21.5 XFP per game, or what would rank 5th-most.
Quick Hits / Notes
- Very quietly, Jamison Crowder ranks 2nd in fantasy points per game (22.50) and 6th in XFP per game (16.9). Through 3 games (one with Joe Flacco, two with Sam Darnold), Crowder totals 24.5, 17.4, and 25.6 fantasy points on 20.0, 14.8, and 15.8 XFP, hitting double-digit targets in each game.
- Even more quietly, Travis Fulgham ranks 3rd in fantasy points per game (22.45) and 23rd in XFP per game (13.5). In Week 4, Fulgham ran a route on 62% of Carson Wentz’s dropbacks, earning just 3 targets, but he caught 2 for 57 yards and a score. His productivity was well rewarded in Week 5, with a 83% route share that resulted in 13 targets, 146 air yards, 1 end zone target, 2 deep targets, and 22.0 XFP (7th-best on the week). Most impressively, he was highly productive on that good volume, scoring 31.2 fantasy points with a 10-152-1 line. With a price-tag of just $4,400 on DraftKings, he’s going to be someone you need to think long and hard about.
- Similarly, Jeff Smith ranks 10th among WRs in XFP over the last two weeks (35.3), and well… that’s something I didn’t expect to be true but it is. Over this span he averages 10.2 FPG, 17.7 XFP per game, 10.0 targets per game, 139.0 air yards per game, 1.5 end zone targets per game, and 3.0 deep targets per game. Over this span, those numbers rank 49th, 11th, 7th, 7th, 7th, and 4th. At the site minimum on DraftKings ($3,000) he’s very intriguing.
- Over the past two weeks (with Tarik Cohen out), David Montgomery is averaging just 16.2 XFP per game – likely a function of those matchups being absolutely brutal for RBs – but he has seen 100% of the backfield’s XFP along with 83% of the team’s snaps. Look for a big game this week against a Carolina Panthers defense that will be down multiple defensive linemen (Brian Burns, Kawann Short, and Yetur Gross-Matos all missed practice on Wednesday).
- Kareem Hunt played 70% of the snaps and handled 80% of the team’s RB XFP in Week 5, earning a season-high 21.1 XFP (4th-best on the week) on 20 carries, 4 targets, and 3 opportunities inside the 10-yard-line. Keep in mind, he came into that game banged up, still dealing with a groin injury, so he might see an even bigger workload in Week 6.
- Through 5 weeks, Robby Anderson ranks 11th in XFP per game (15.8) while DJ Moore ranks 28th (12.5). Anderson has now exceeded Moore in XFP in three straight games, more than doubling the worth of Moore’s usage over this span (16.9 XFP vs. 8.0). Anderson ranks 10th in FPG (18.2), while Moore ranks 34th (13.2).
- Following Dalvin Cook’s injury, Alexander Mattison (34 snaps) dramatically out-snapped Mike Boone (4) and Ameer Abdullah (1), earning 18 of 20 carries and 14 of 17 routes (one target). He finished the day with 136 yards on 23 touches.
- Due to injury, Keenan Allen was limited to just 12 of 69 snaps (17%), and Mike Williams filled in as the alpha. He turned 17.3 XFP (16th-most) -- on 8 targets, 157 air yards, 4 deep targets – into 27.9 fantasy points.
- In Austin Ekeler’s absence, Justin Jackson earned 59% of the snaps, 63% of the routes, and 71% of the XFP. He saw 15 carries and 6 targets to Joshua Kelley’s 11 and 1. His 16.3 XFP ranked 15th-best of the week, well ahead of Kelley (6.6 XFP, 37th). Last week’s pass-heavy script tilted more towards Jackson’s favor, but expect a much closer split in games Los Angeles is favored.
- The Los Angeles Rams rank 9th in team RB XFP per game (26.9). For those holding out hope of Cam Akers taking over this backfield and ultimately winning you a championship, here’s what it would take: a 50% market share over that backfield would yield low-end RB2 volume (13.5), a 66% market share would rank about 10th (17.8), a 75% market share would yield mid-range RB1 volume (20.2), and an 80% market share would rank top-5 (21.5).
- Darius Slayton leads all non-RBs in team XTD market share (31%), followed by Adam Thielen (29%), Jimmy Graham (29%), Mike Evans (27%), and Mark Andrews (26%). Keep this in mind for games those teams have an implied point total above their league average PPG.
RB Leaders by Snap% (Weeks 4-5)
1. David Montgomery (83%)
2. Miles Sanders (82%)
3. Joe Mixon (80%)
3. Melvin Gordon (80%)
5. Ezekiel Elliott (79%)
6. Mike Davis (76%)
7. Devin Singletary (74%)
8. Alvin Kamara (72%)
9. James Robinson (67%)
10. Kenyan Drake (66%)
11. Josh Jacobs (66%)
12. Clyde Edwards-Helaire (66%)
High-Ceiling Tournament Options (As Measured by Deep Targets per Game)
1. Marquise Brown (3.0)
1. Calvin Ridley (3.0)
1. Jeff Smith (3.0)
4. DK Metcalf (2.6)
5. Jeff Smith (2.5)
5. Marquez Valdes-Scantling (2.5)
7. DeSean Jackson (2.3)
8. Adam Thielen (2.0)
8. Tyreek Hill (2.0)
8. Courtland Sutton (2.0)
8. Christian Kirk (2.0)
8. A.J. Green (2.0)
13. Michael Gallup (1.8)
Top DFS Values (DraftKings)
1. Jeff Smith, WR (5.89X)
2. Damiere Byrd, WR (3.44X)
3. Logan Thomas, TE (3.34X)
4. Aaron Jones, RB (3.16X)
5. Joe Mixon, RB (3.15X)
6. A.J. Green, WR (3.15X)
7. Chris Hogan, WR (3.08X)
8. Travis Fulgham, WR (3.06X)
9. Mike Davis, RB (3.04X)
10. Derrick Henry, RB (2.96X)
11. DeSean Jackson, WR (2.92X)
12. Tee Higgins, WR (2.90X)
13. Myles Gaskin, RB (2.89X)
Top DFS Values (FanDuel)
1. Jeff Smith, WR (3.61X)
2. Mike Davis, RB (2.84X)
3. Joe Mixon, RB (2.83X)
4. Aaron Jones, RB (2.82X)
5. Allen Robinson, WR (2.76X)
6. Myles Gaskin, RB (2.73X)
7. Melvin Gordon, RB (2.55X)
8. Jamison Crowder, WR (2.55X)
9. Travis Fulgham, WR (2.54X)
10. Tee Higgins, WR (2.48X)
11. Robby Anderson, WR (2.43X)
12. Darius Slayton, WR (2.41X)
13. David Montgomery, RB (2.40X)