Hello, and welcome to the Week 7 XFP Report. If you’re unfamiliar with XFP, I’ll get to that in a little bit.
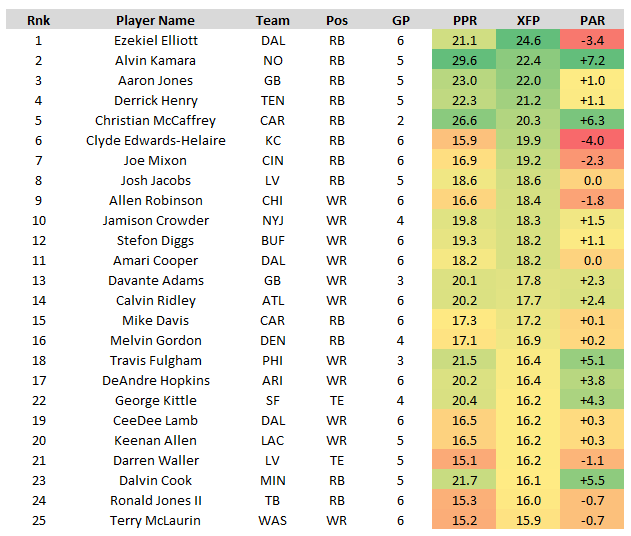
But basically, every week we’re going to be telling you which players are seeing the best volume for fantasy, as measured by Expected Fantasy Points (XFP). We’ll be telling you who the best buy-low and sell-high candidates are, as measured by Points Above Replacement (PAR), or the differential between actual- and expected fantasy points. This is an especially effective approach in DFS, where players are typically priced by production rather than volume, though PAR will regress to the mean. And (at the end of the article) we’re going to be telling you who the best volume-per-dollar DFS plays are.
What is XFP?
Premium subscribers can access XFP (and other advanced stats like air yards, deep targets, end zone targets) here.
Expected fantasy points (XFP) is flat-out the best and most comprehensive way of measuring a player’s volume. It’s telling you – based on a player’s unique usage – how many fantasy points that player should have scored. It’s telling you how many fantasy points a perfectly league-average RB, WR, or TE would have scored with that same exact volume. It looks at every individual carry by down and distance and distance from the end zone and every individual target by depth of target and distance from the end zone, and then cross-references each carry and target to each carry and target with those specific qualifiers over a multi-year sample to tell you what exactly those carries and targets are worth (historically).
Expected touchdowns (XTD), same thing. RBs score from the one-yard line on 54% of their attempts. RBs score from the 17-yard line only 3.6% of the time. So why ever use “red zone carries,” which treats both carries the same, as a fantasy stat? I have no idea.
Why doesn’t everyone point to XFP in their fantasy research? I have no idea. Once you have XFP and XTD you can contrast that with a player’s actual fantasy points or actual touchdown total to tell you how efficient a player has been (PAR). This is especially useful in highlighting regression candidates, buy-low targets, and mispriced players for DFS.
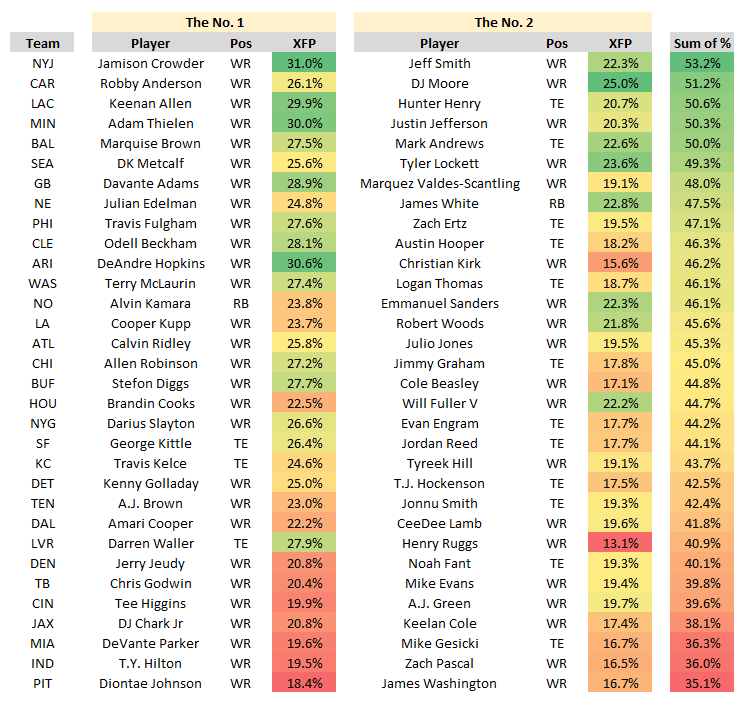
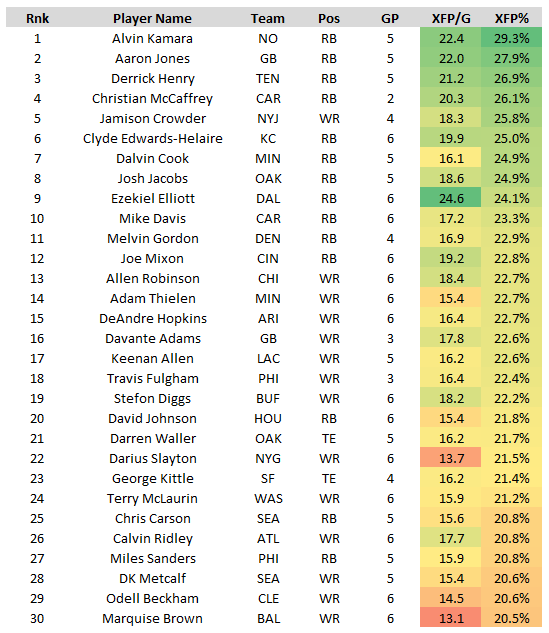
Through three weeks of action, here are the top-25 players in expected fantasy points (XFP) per game:
The Top-25
(Negative) Regression Candidates – Outscoring XFP by…
1. Robert Tonyan, TE (200%)
2. Raheem Mostert, RB (172%)
3. Chase Claypool, WR (171%)
4. Justin Jefferson, WR (162%)
5. Tyreek Hill, WR (135%)
6. Dalvin Cook, RB (134%)
7. Alvin Kamara, RB (132%)
8. DK Metcalf, WR (132%)
9. Will Fuller, WR (130%)
10. Jonnu Smith, TE (129%)
11. Chris Carson, RB (128%)
12. Adam Thielen, WR (126%)
XTD (Positive) Regression Candidates
1. Clyde Edwards-Helaire, RB (-0.71)*
2. Jamaal Williams, RB (-0.46)
3. Jeff Smith, WR (-0.43)
4. A.J. Green, WR (-0.43)
5. Myles Gaskin, RB (-0.43)
6. Michael Gallup, WR (-0.34)
7. Julian Edelman, WR (-0.33)
8. Chris Conley, WR (-0.32)
9. Zack Moss, RB (-0.32)
10. Devin Singletary, RB (-0.30) * Averaging 0.71 fewer touchdowns per game than expected, worth an additional 4.3 FPG (multiply by 6)
Wide Receivers
D.J. Chark, WR, Jacksonville Jaguars
XFP: 14.0, PPR: 13.9, PAR: -0.1
Chark was your XFP leader in Week 6, totaling 29.5 XFP on 194 air yards (3rd-most) and 14 targets (most). Unfortunately, he wasn’t very efficient on that good volume, scoring just 11.5 fantasy points. What went wrong? Per Chark, “I mean, I felt like we was open.” And he very well might be right. So much of a WR’s PAR is out of their control – WR efficiency is heavily tethered to QB efficiency.
But from a fantasy perspective, this is sort of who Chark is and who he’s going to be all year. He’s a phenomenal talent, and he’s seeing – although not a high number of targets – high-quality targets. But those high-quality targets are naturally going to make him more volatile and boom-or-bust week-to-week. To me, commonly used metrics like air yards and deep targets are best used to describe what type of player a specific WR is, rather than how valuable their role is -- XFP, which incorporates air yards, is the superior metric in that regard. Air yards are telling me how safe or volatile a player is, how high or low their ceiling and floor is for fantasy. High air yardage totals (or deep targets per game) relative to XFP would tell me that a specific player is going to be boom-or-bust for fantasy, and likely better suited for DFS tournaments. The reverse would tell me a player offers a high-floor, and might be suited for DFS cash games.
(Chark actually probably isn’t even a great example here -- Marquise Brown would be -- I just thought this was an important or at least interesting aside. Anyway…)
Chark saw 3 deep targets totaling 110 air yards last week, worth a combined 7.3 XFP. On average (this season), deep targets have only been catchable (per PFF) about 43% of the time, and deep targets have only caught (factoring in drops) 39% of the time. If those deep targets were caught, they’d be worth somewhere between 14.0 fantasy points at a minimum and 42.2 fantasy points at a maximum (212 total yards from the end zone). But he caught zero, totaling zero fantasy points.
43% of Chark’s deep targets have been deemed catchable by PFF, so right around the league-average rate. However, that’s well below Justin Jefferson (80%), CeeDee Lamb (78%), and D.K. Metcalf (67%). That’s also well above Marquise Brown (31%), who actually leads the league in deep targets (16) and air yards per route run (3.98). What does this mean? Like with XFP, we should also expect a regression to the mean in deep target accuracy – though, note, Russell Wilson’s mean is still likely quite a bit higher than Lamar Jackson’s or Gardner Minshew’s.
So, basically, just note that WRs like Chark and Brown are always going to be highly-volatile fantasy assets, but always in play for DFS tournaments as potential slate-busters. You just need a few coin-flips to go your way. And when looking at our data, know that XFP will be best at providing a player’s median and mean expectation, but using that in conjunction with air yards and/or deep targets per game can better represent a player’s floor vs. ceiling expectation – the more air yards or deep targets, the more volatile this player is going to be week-to-week.
Jamison Crowder, WR, New York Jets
XFP: 18.3, PPR: 19.8, PAR: +1.5
Say what you want about Adam Gase, but the man knows how to get his starting slot WR fantasy points – in fact, it’s the only thing he’s ever done well. Through 4 games, Crowder ranks 2nd in XFP per game (18.3) and 6th in FPG (19.8). He finished 2nd among all WRs in XFP last week (22.7), after prior finishes of 19th, 16th, and 8th. Even across his 2-game absence, slot WR Braxton Berrios averaged 17.2 FPG. Crowder saw 13 targets last week (now hitting double-digit targets in every game thus far), but scored just 11.8 fantasy points, after 3-straight 100-yard games. He’ll get Buffalo’s slot funnel defense this week (8th-most FPG allowed to slot WRs, 10th-fewest FPG allowed to outside WRs), who he’s gashed for 23.0 FPG on 13.3 targets across his last 3 games against them. As just the 18th highest-priced WR of the slate on DraftKings, he seems priced at just about his floor.
Travis Fulgham, WR, Philadelphia Eagles
XFP: 16.4, PPR: 21.5, PAR: +5.1
Travis Fulgham went Full HAM again last week, turning 22.2 XFP into 19.5 fantasy points. He’s the only player to hit 20.0 XFP in each of the past two weeks, hitting 22.0 twice. Over this span he’s averaging an absurd 174.5 air yards, 12.5 targets (33% TMS), 2.5 end zone targets, and 2.0 deep targets per game. And since his first game of the season, he’s averaging 6.0 catches, 94.7 yards, and 1.0 touchdowns per game. He now ranks -- believe it or not -- 1st among all WRs in FPG (21.5).
Allen Robinson, WR, Chicago Bears
XFP: 18.4, PPR: 16.6, PAR: -1.8
Robinson hit a season-low in XFP last week (13.5), but still leads all WRs in XFP per game (18.4). He’s now seen at least 8 targets in each of his last 12 games, averaging 11.2 targets per game over this span. Ranking just 19th in FPG (16.6), he’s a glaring (positive) regression candidate. Although as we just discussed, WR efficiency is largely a product of QB efficiency – and that’s always going to be a concern for him – there is another factor at play here.
Nick Foles took over for Mitchell Trubisky in Week 3, and, in a soft matchup, Robinson scored 31.3 DKFP on 13 targets. In Week 4, Robinson took advantage of a perfectly neutral matchup, scoring 26.1 DKFP on 10 targets. In Week 5, Robinson was inefficient on 16 targets, but still walked away with 19.0 DKFP in a brutal matchup. His Week 6 matchup was even tougher, and he scored just 10.3 DKFP on 9 targets. Unfortunately for him, this brutal stretch of schedule will continue for some time. In Week 7, he gets a Rams defense that is allowing the fewest FPG to opposing outside WRs (13.7). His Week 8 matchup (the Saints) also ranks top-10, representing his fourth-straight game against a defense ranking in the top-10 in FPG allowed to outside WRs.
Terry McLaurin, WR, Washington Football Team
XFP: 15.9, PPR: 15.2, PAR: -0.7
McLaurin has a similar issue to Robinson. He’s a phenomenal talent, saddled with a bottom-5 QB talent, tanking his efficiency numbers. Still, that didn’t slow him down last year (+1.2). Though, interestingly, McLaurin accumulated the bulk of his PAR in only a handful of games – 3 games with a PAR over +12.0, 10 games with +3.0 or less, and 7 (of 14) games in the negative. We’re sort of seeing the same thing this year – 5 of 6 games in the negative, 1 game over 10.0 (Week 2). Maybe – like some of the other receivers we discussed earlier – he too is a highly-volatile fantasy asset better suited for DFS tournaments.
But in his defense, he is seeing good volume. He ranks 19th in FPG (16.6), but 11th in XFP per game (18.4), 8th in targets per game (9.7), and 9th in air yards per game (110.5). He’s also had a brutal schedule to start – Darius Slay’s shadow coverage in Week 1, Patrick Peterson’s shadow coverage in Week 2, James Bradberry’s partial shadow coverage in Week 6. He’s also faced the Ravens and Rams, who rank 12th and 1st in FPG allowed to opposing outside WRs. And still, he’s posted highs of 28.5 (Arizona) and 24.8 (Ravens) DKFP.
This week he gets a Dallas defense that’s giving up the 3rd-most FPG to opposing outside WRs (28.7). Almost every high-level WR they’ve faced has gone off on them – Robert Woods (20.9 DKFP), Calvin Ridley (32.9), Tyler Lockett (39.0), D.K. Metcalf (24.0), Odell Beckham Jr. (38.4), Darius Slayton (23.9), and Christian Kirk (22.6). The only ones who flopped were Cooper Kupp (8.0) and DeAndre Hopkins (9.3), and their QBs combined to complete just 29 total passes across those two games.
Tight Ends
- Like over the last few seasons, there’s a Big 3 at TE. Only, this time, Zach Ertz’s invite got lost in the mail. Darren Waller leads in XFP per game (16.2), followed by George Kittle (16.2) and Travis Kelce (15.5). Ertz, a distant 4th, averages just 12.3 XFP per game. Kittle leads in FPG (20.4), followed by Kelce (18.1) and then Waller (15.1).
- Jonnu Smith was averaging 13.2 XFP per game and 17.5 FPG, before seeing his average take a hit after last week’s game. Due to injury, Smith played on just 41% of the team’s snaps to Anthony Firker’s 56%. Smith scored just 2.3 fantasy points on a 3.1-point expectation. Firkser scored 25.3 fantasy points on a 17.7-point expectation. That was a season-high for any Titans TE, coming on 10 targets and 74 air yards.
- Robert Tonyan is a glaring regression candidate, ranking 6th in FPG (13.2) but just 32nd in XFP per game (6.6). He’s scored 5.5, 33.8, 16.0, and 10.5 fantasy points on just 4, 6, 5, and 3 targets since Week 2.
- Quietly, Jimmy Graham ranks 6th in XFP per game (12.0) – 9th in targets per game (6.0), 2nd in XTD per game (0.67) – and 8th in FPG (11.3). This is who he’ll be all year, and who he was in 2017, extremely heavily-reliant on touchdowns for fantasy production.
- Gronk is back? Maybe. Since Week 3, Rob Gronkowski ranks 5th in XFP, averaging 11.2 XFP per game, along with 6.0 targets and 10.4 FPG on a 68% route share (81% last week).
- Austin Hooper is averaging 12.3 XFP, 7.7 targets, and 11.8 FPG over his last three games (on a 70% route share). For perspective, those numbers would rank 5th-, 4th-, and 8th-best if over the full season.
- Trey Burton ranks 11th in XFP over the past three weeks, averaging 8.9 XFP per game. Over this span, he averages 5.3 targets per game (15% TMS) on a 57% route share (77% last week), along with 11.3 FPG.
- Irv Smith Jr. has seen an increased role in recent weeks, averaging 5.0 targets, 1.5 deep targets, 9.0 XFP, and 10.0 FPG on a 75% route share over his last two games.
- With Jordan Akins out for Weeks 5 and 6, Darren Fells has run a route on 70% of Deshaun Watson’s dropbacks, averaging 4.5 targets, 8.5 XFP, and 17.1 FPG.
- Albert Okwuegbunam is an intriguing min. priced TE for DFS if Noah Fant sits out again this week. He scored just 6.5 fantasy points, but on a 12.8 expectation in his first game active. He ran a route on just 56% of Drew Lock’s dropbacks, but saw 6 targets, 4 end zone targets, and 2 deep targets.
- Zach Ertz ran 28 routes last week, before exiting early due to injury. In his absence: Richard Rodgers totaled 19 routes and 3 targets to Jason Croom’s 1 route and 1 target (also 1 touchdown scored).
Running Backs
Joe Mixon, RB, Cincinnati Bengals
XFP: 19.2, PPR: 16.9, PAR: -2.3
Here’s what we said about Joe Mixon last week:
Is Mixon finally officially a bell cow? I think so. Across his last two games – one with very good game script (an 8-point victory), one with very bad game script (a 24-point loss) – Mixon is averaging 25.1 XFP, 24.5 carries, and 7.0 targets on an 80% snap share. For perspective, those numbers rank first, first, second, and third-best over this span. However, even after his big Week 4, he’s still a massive regression candidate and a glaring trade target – his volume is much better than his production implies, and maybe your leaguemates aren’t aware of that fact.
Mixon now ranks 3rd among all players in total XFP, but just 20th in total fantasy points. He looks boom-or-bust on paper, but he’s one of just 3 players to reach at least 15.0 XFP in each of the last 4 weeks. I assure you, he's going to bounce-back in a big way soon, but maybe not this week, as 9.5-point underdogs against a Colts defense that ranks 3rd-best in FPG allowed to opposing RBs.
What happened in Week 6? Mixon missed time due to injury and got robbed of what could have been a 3-touchdown day. Mixon missed nearly all of the 2nd quarter due to injury, and, adjusting for that (throwing out the entire 2nd quarter), his 17.6 XFP total should have been closer to 23.5, along with 22.7 carries and 4.0 targets.
David Montgomery, RB, Chicago Bears
XFP: 15.9, PPR: 13.1, PAR: -2.8
Congratulations to Montgomery, who scored just 13.7 fantasy points on a 24.4-point expectation against the worst run defense in football. He now ranks as the 4th-least-efficient RB in fantasy, falling 18% short of his volume-based expectation. That’s the bad news, the good news (I guess), is that he is seeing terrific volume. Over the past three weeks, Montgomery has seen 100% of the team’s RB XFP (and 84% of the team’s snaps), averaging 18.9 XFP per game (9th-most).
Other / Notes
- We featured DK Metcalf in this article last week (before his bye). You can read what we had to say about him here.
- Clyde Edwards-Helaire ranks 5th in XFP per game (19.9), but just 12th in FPG (15.9), suffering from some brutal touchdown luck. He’s seen 77.3% of the Chief’s backfield XFP through 6 games. So, for perspective, if that shifts to 60/40 once Le’Veon Bell joins the team, he’d lose about 4.5 XFP per game, or enough to drop him from top-5 to 15th.
- Tim Patrick’s 207 air yards led the league last week. He now averages 15.4 XFP over his last two games (20th-most), along with 8.0 targets (29% market share) and 152.0 air yards (22%) per game. Over his last 3 games, he’s averaging 17.2 FPG which ranks 16th-most.
- Okay, so, Justin Jefferson is awesome. But he’s also a massive regression candidate. He ranks 1st in FPG since Week 3 (21.9), but ranks 34th in XFP per game (12.8) over the same span. The bad news is, this isn’t sustainable, and he’s due for a massive regression. The good is – congratulations – you’ve still found yourself a likely every-week stater.
- Since Week 2, Amari Cooper is averaging 17.7 XFP per game to CeeDee Lamb’s 17.4 to Michael Gallup’s 12.5. For perspective, those numbers rank 4th, 5th, and 30th-best over this span. Since Week 2, Cooper averages 18.2 FPG to Lamb’s 17.6 and Gallup’s 10.8. Those numbers rank 10th, 12th, and 48th-best over this span.
- If we exclude Week 2, when Will Fuller was dealing with injury, he’s averaging 14.9 XFP per game and 19.5 FPG. For perspective, those numbers would rank 15th- and 8th-best among all WRs. Over the last two weeks, Brandin Cooks averages 20.1 XFP per game and 26.0 FPG. Those numbers rank 3rd- and 2nd-best over this span. By XFP, Cooks has eclipsed Fuller in both games, but not by much (20.8 vs. 14.5, 19.3 vs. 18.5).
- JuJu Smith-Schuster is averaging 9.0 XFP per game, 28.0 air yards per game, and 12.1 FPG. For perspective, those numbers rank 70th, 124th, and 43rd-best among WRs.
- If Carlos Hyde sits out again this week, expect a slightly better workload for Chris Carson. Hyde suffered a knee sprain in Week 3. Through the first two weeks of the season, Carson handled just 59% of Seattle’s backfield XFP. Over Seattle’s last two games (with Hyde out), Carson handled 78% of the team’s backfield XFP. In other words, that’s a boost of about +3.4 XFP if Hyde sits.
- After handling 80% of the backfield XFP in Week 5, that number dipped to just 63% for Kareem Hunt in Week 6. I thought that might just be a misleading stat – he was pulled early in a blowout – but he played on just 66% of the team’s snaps in the first half.
- With Miles Sanders out for Week 7, expect Philadelphia’s backfield to look a lot like what we saw in Week 1. Or at least, what it looked like before Boston Scott exited the game due to injury on the penultimate drive of the 2nd quarter. In the first half of that game, Scott played on 63% of the snaps, earning 4 of 8 carries and 2 of 2 targets out of the backfield (54% route share).
- Devonta Freeman saw a bell cow workload last week, earning 18 carries and 2 targets on 76% of the snaps. He handled 89% of the team’s backfield XFP last week, after prior shares of 52%, 56%, and 20%. But in a game the Giants led throughout (which isn’t something that’s going to happen often), it’s likely this was all a mirage – merely a function of game script, and Dion Lewis will go back to stealing snaps on obvious passing downs and when the Giants get behind (which will be often).
- D’Andre Swift ranked 4th in XFP (20.9) and 2nd in fantasy points (29.4) in Week 6. That’s the good news. The bad news is, that still represented just 55% of Detroit’s backfield XFP. Expect this to remain a committee backfield for however long Matt Patricia remains employed.
- Tee Higgins averages 14.8 XFP over his last 4 games, hitting at least 13.9 in every game, and out-totaling Tyler Boyd in each of his last 3 games. For perspective, that ranks 17th-best over this span, and his 15.7 FPG average over this span ranks 20th-best.
- Jonathan Taylor hit 15.6 XFP in Week 1, and then 17.0 in Week 2. However, since then, he’s seen lowly totals of just 11.2, 11.1, 11.4, and then 11.7 last week. As a share of the team’s backfield XFP, he’s seen 53% (last week), 58%, 44%, 36%, and 76% (Week 2).
- In Austin Ekeler’s absence in Week 5 (prior to the bye), Justin Jackson earned 59% of the snaps, 63% of the routes, and 71% of the XFP out of the backfield. He saw 15 carries and 6 targets to Joshua Kelley’s 11 and 1. His 16.3 XFP ranked 15th-best of the week, well ahead of Kelley (6.6 XFP, 37th). Week 5’s pass-heavy script tilted more towards Jackson’s favor, but expect a closer split in games Los Angeles is favored.
- Phillip Lindsay scored 10.1 fantasy points on a 14.1-point expectation in Week 6. This represented 75% of the backfield XFP, so quite a bit more than what he saw in a timeshare with Royce Freeman for all of last season (56%), but it’s probably a moot point with Melvin Gordon likely to return this week.
Top DFS Values (DraftKings)
1. Albert Okwuegbunam, TE (5.2X)
2. Jeff Smith, WR (4.6X)
3. Clyde Edwards-Helaire, RB (3.3X)
4. Ezekiel Elliott, RB (3.2X)
5. Logan Thomas, TE (3.1X)
6. Jamison Crowder, WR (3.1X)
7. Melvin Gordon, RB (3.0X)
8. A.J. Green, WR (3.0X)
9. Chris Hogan, WR (3.1X)
10. Aaron Jones, RB (3.1X)
11. Joe Mixon, RB (3.0X)
12. Alvin Kamara, RB (2.8X)
Top DFS Values (FanDuel)
1. Jeff Smith, WR (2.9X)
2. Jamison Crowder, WR (2.9X)
3. Clyde Edwards-Helaire, RB (2.8X)
4. Albert Okwuegbunam, TE (2.7X)
5. CeeDee Lamb, WR (2.6X)
6. Joe Mixon, RB (2.6X)
7. Ezekiel Elliott, RB (2.6X)
8. Aaron Jones, RB (2.6X)
9. Melvin Gordon, RB (2.5X)
10. David Johnson, RB (2.5X)
11. Stefon Diggs, WR (2.4X)
12. Alvin Kamara, RB (2.4X)