
Introduction
Last season I penned what might be my magnum opus — “Upside Wins Championships” — which introduced a draft-strategy (or, really, more of a draft-‘ethos’) describing essentially that; when it comes to winning fantasy championships, UPSIDE IS EVERYTHING. A player’s bull-case projection matters much more than his base-case projection which matters far more than his bear-case projection. Leagues are won and lost not by balanced teams drafting a number of good-to-great ADP-beaters, but by teams who correctly identified a few key league-winners and rode those players all the way to a Championship title. And by “a few," I mean very few — there may only be 6-12 players who actually matter for fantasy in any given season.
In other words, our goal when drafting should be trying to identify players with league-winning upside. It’s not easy, but as I showed here, it’s probably a lot easier than you think. In that article (released in 2020), we took a look at the top-10 league-winning players over the prior three seasons, and after re-examining my pre-season analysis on each player, it was clear that in nearly every instance I did correctly identify the league-winning upside in each player.
In today’s article, we’re going to be doing something similar but from a different angle. We’ll be working backwards now, looking at the top league-winners over the past five seasons, but instead of viewing each player through the lens of an ex-ante analysis, we’ll be applying an ex-post analysis on each position. Essentially, we’re trying to find a common thread that links some or all of these players together. And in so doing, hopefully, identify potential league-winners in 2022 and beyond.
Note: Special thanks to Tristan Cockroft of ESPN. His annual articles for ESPN were the source of all our data referenced throughout this piece. You can read his 2021 articles here and here.
Methodology
How are we defining league-winners? Rather than merely highlighting ADP-beaters — which, as we showed in “Upside Wins Championships” is exactly the wrong way to think of league-winners — we’re defining league-winners by their rate of occurrence on ESPN Playoff teams.
A few things:
1) This means every observation and relevant takeaway must be understood within the context of ESPN’s unique settings. An ESPN standard league is as follows:
10 teams
PPR scoring, 4 points per passing touchdown
Starting 1QB, 2RB, 2WR, 1TE, 1Flex, 1K, 1DST
7 bench spots
In other words, this is the worst type of league to employ a Zero-RB strategy. Running backs are by far the most valuable position in ESPN standard leagues, and there’s not even really a close second. As for the reason, it has to do with positional scarcity, and was explained beautifully and succinctly by Adam Harstad here.
Imagine the same type of league, but with an added Superflex spot. Quarterbacks would become roughly 2X as valuable, and now become at least nearly as valuable as running backs. Or, imagine if instead of adding a Superflex spot, the league added another starting wide receiver spot. Wide receivers would become roughly 1.4X more valuable, but would still be (~33%) less valuable than running backs on the whole. This is also one of the better types of leagues to chase upside. The quality of the available players on your waiver wire is going to be significantly better here (10 teams, 9 starters, 7 bench spots) than in an FFPC high-stakes league (12 teams, 10 starters, 10 bench spots).
2) Why did we choose “rate of occurrence on ESPN Playoff teams” rather than “rate of occurrence on ESPN Championship-winning teams?” Forgive me for going deep into the weeds once again, but fantasy playoff performance is mostly a function of variance while fantasy regular season performance is far more a function of skill.
Who is the “best” team in the NFL in any given season? Probably the team with the best record across the largest sample, and not necessarily the team that ultimately won the Super Bowl. Though the team with the best odds of winning the Super Bowl is probably the team with the best regular season record, that doesn’t frequently happen. Essentially, being the best team across 17 games is far more representative of skill than being the only undefeated team through three or four consecutive games. This is true in all games of skill and chance — the smaller the sample, the more variance (the more luck and less skill) at play.
The same thing is true with fantasy football. It’s easier to be the best team from Weeks 15-17 than it is to be the best team from Weeks 1-14. And the same thing is true with fantasy football players. Who is most likely to dominate from Weeks 15-17? Probably the players who dominated from Weeks 1-14, though that’s not always the case.
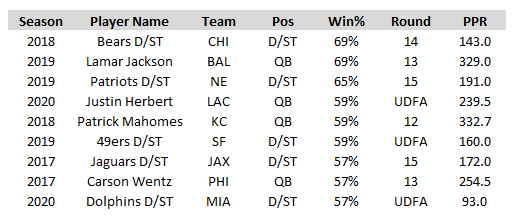
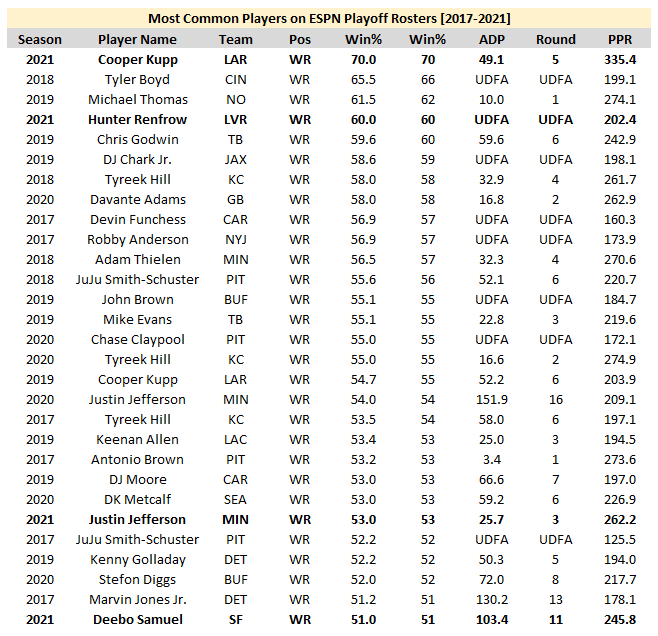
Top League-Winners (2017-2021)

NOTE: In the above chart, as outlined in the Methodology breakdown, “Win%” should be read as the percentage of teams making the fantasy playoffs with that particular player on the roster.
Quarterbacks
Positional Analysis

At the quarterback position, I saw two immediate takeaways:
1) Clearly, you don’t need to draft a quarterback high. In fact, it’s probably a mistake to do so.
Only 4 of the top-15 quarterbacks on this list were drafted in single-digit rounds (27%).
2) Even if you do hit on a late-round gem, it’s still not really much of an advantage.
Typically, the top QB provides about as much value as the top defense.
I think this goes back to our earlier point on scarcity. Quarterbacks outscore all other positions, but they’re the least-scarce position (essentially tied with defenses and kickers) and thus far less valuable than RBs, WRs, and TEs in this format.
And, again, even if you do hit on a late round gem (even the greatest late round QB gem of all-time), it’s still not really much of an advantage.
In 2018, Patrick Mahomes scored the most fantasy points by any quarterback in any season in NFL history. In 2019, Lamar Jackson averaged the most FPG of any quarterback in any season in NFL history. Both players accomplished these feats with an ADP in the double-digit rounds. And even so, both ranked quite low overall (in terms of helping you advance into the playoffs). In fact, Mahomes ranked only 10th-overall in Win% (a.k.a. percentage of ESPN playoff teams rostering this player) in 2018.
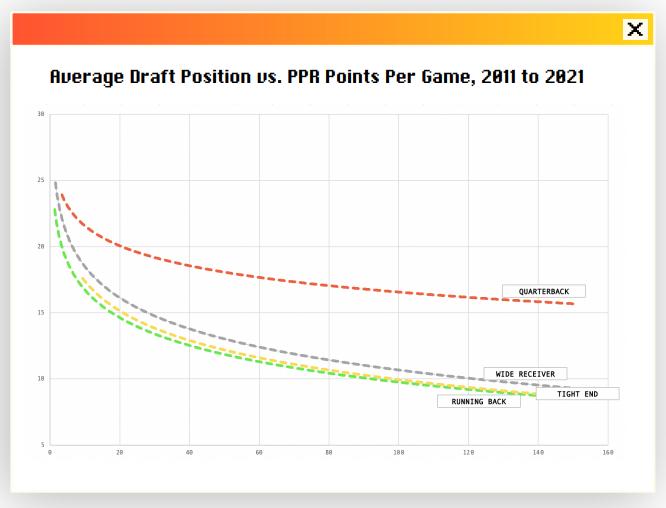
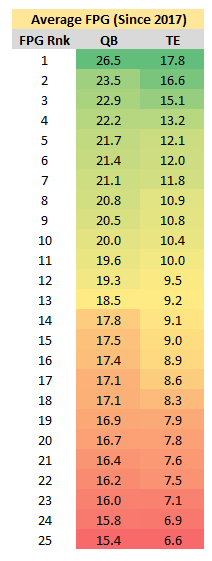
In addition to (or in conjunction with) the point that QBs are the least-scarce of the Big-4 positions, scoring is also flattest at the QB position. Or in other words, a highest-end QB doesn’t provide anywhere near as much value relative to your league’s worst starting QB (or the best QB available on waivers) as would a highest-end RB, WR, or TE. And that effect becomes more exaggerated when you factor in ADP, and thus opportunity cost.
JJ Zachariason showed that here in this graphic from the LateRound Draft Guide. (Note how flat the line is for QBs in comparison to RBs, WRs, and TEs.):
Although there’s a narrative going around that we’re witnessing a glorious resurgence from the QB position — that QBs and especially highest-end QBs are more valuable and safer (or, rather, their production is becoming more predictable) than they’ve been in nearly a decade. And as such, we should consider drafting QBs far earlier than we’ve grown accustomed.
But our numbers here don’t really bear that out.
Justin Herbert was the league’s most valuable fantasy QB last season, ranking just 16th among all players in playoff win-rate (50%) with a Round 7 ADP. Josh Allen (Round 3, 49%), who scored the 4th-most fantasy points by any QB in NFL history, ranked barely above Matthew Stafford (Round 11, 48%) and Tom Brady (Round 7, 48%).
And by VORP (Value Over Replacement Player) things become even more clear (see below chart). Although it’s true that QBs are scoring more fantasy points over the past 2-4 years, that doesn’t mean QBs are becoming more valuable if their more-cheaply-acquired peers are also scoring more points at a similarly high rate. And indeed, highest-end QBs aren’t out-scoring their peers at a historically high margin, but low-end QB1s are. That’s where the value has been the past two seasons, and that’s where I think the value will be in 2022.
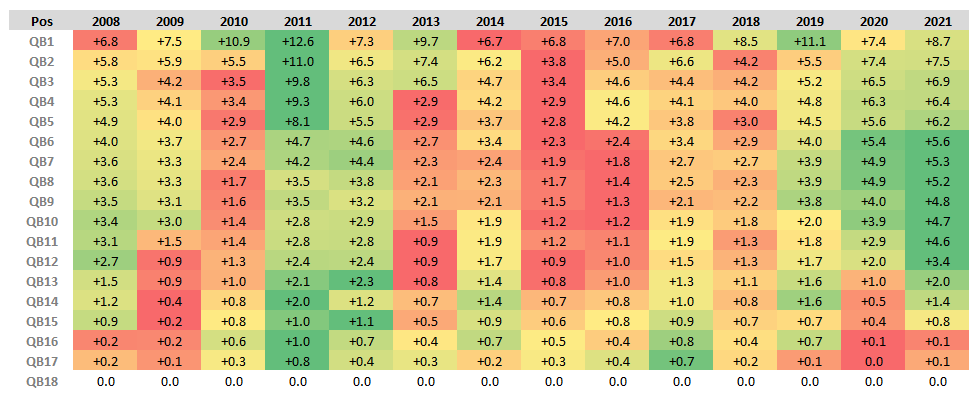
NOTE: In this instance “Replacement Player” is defined as “Best Possible Replacement Player Available on Waivers." Last season, and on average, 17.5 QBs were rostered in any given week in ESPN 10-team leagues. So QB18 was used as our baseline.
Lesson Learned: As ridiculously good as Josh Allen, Patrick Mahomes, Justin Herbert, and the Konami Code QBs certainly are, you’re still better off leaning towards under-paying rather than overpaying for a quarterback in fantasy.
Player Analysis
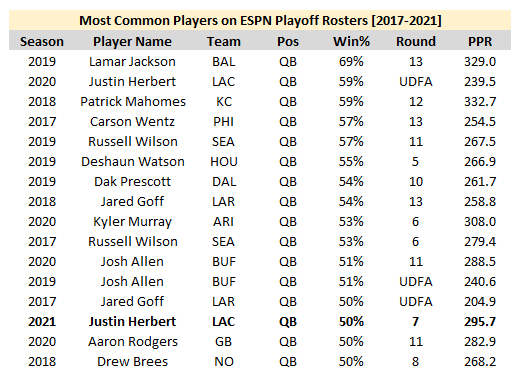
Interestingly, 3 of our top-4 league-winning QBs were entering their second season in the NFL. Of the top-15 QBs, a whopping 47% were entering their second season. And two-thirds of the top-15 (67%) were entering their second or third season in this league. That’s what we in the industry like to call “statistically significant.” And, to me, that implies what we already know — we want to be drafting ascending talents; it pays to gravitate towards unknown commodities (the known commodities are already priced as such).
Actionable Takeaway: Perhaps current drafters are sleeping on one or more of the following (and fairly affordable) sophomores in what was supposedly a historically great class: Trey Lance (ADP: QB11), Justin Fields (QB16), Trevor Lawrence (QB18), Zach Wilson (QB22), Mac Jones (QB24), and Davis Mills (QB28). And, indeed, I think they are — Lance and (then) Fields are two of my favorite QB picks at current ADP. And, obviously, the bull-case argument is pretty easy for Lawrence and Wilson — the first two selections in the 2021 NFL Draft. Although the third-year QBs are far less affordable (minus Tua Tagovailoa — who now, by the way, has Tyreek Hill to throw to), a similar argument could be made. For instance, Justin Herbert is priced as the QB3 after finishing as the QB2 by FPG (22.4), but what if he still has room to grow, and 22.4 FPG is still far off his peak? And, of course, we can say the same exact thing for Joe Burrow (QB7) and Jalen Hurts (QB6).
Seven of our top-15 quarterbacks averaged at least 3.5 rushing FPG. And on average, our top-15 QBs averaged 4.9 rushing FPG (would have ranked 6th-most at the position last year). This is no coincidence. Mobile quarterbacks are a cheat code in fantasy football. Clearly, when 50 rushing yards and one rushing touchdown is equivalent to 175 passing yards and one passing touchdown, Lamar Jackson has a massive advantage over a pure-passer like Derek Carr.
Actionable Takeaway: Again, this is another positive indicator for Trey Lance (QB11) and Justin Fields (QB16). They ranked (respectively) 2nd (60.0) and 7th in rushing yards per start last season (38.6). And their numbers in college always hinted at massive Konami Code-potential. Kyler Murray averaged 12.8 rushing FPG and 76.5 rushing YPG in his best season in college. Lance averaged 13.3 rushing FPG and 77.0 rushing YPG across his college career at North Dakota State. Fields averaged 10.2 rushing FPG and 64.6 rushing YPG in 2020… There also may be some underrated Konami Code upside to Daniel Jones (QB21), who ranks 7th in rushing yards per start since entering the league (26.9), behind Josh Allen (34.6) and then Deshaun Watson (27.7).
In several instances, we might have been underrating the impact of a new and improved head coach or offensive play-caller. This was at least certainly the case with Matthew Stafford (2021), Lamar Jackson (2019), Dak Prescott (2019), and Jared Goff (2018). (As I detailed in my pre-draft analysis, Jackson and Prescott were my two highest-owned quarterbacks in 2019 for this reason, among others.)
Actionable Takeaway: This is yet another positive indicator for Justin Fields (QB16). And my thoughts on him are eerily reminiscent of my offseason stance on Jackson in 2019 — who, you may remember, was my single highest-owned player that year (see link above). Much like the 2018 Baltimore Ravens, the 2021 Chicago Bears offense was built with a sloth-like pocket passer in mind (Joe Flacco / Andy Dalton), and was not at all tailored towards their younger QB’s hyper-mobile skillset. But this year, per The Athletic NFL Staff, “We can expect some RPOs, an outside-zone run scheme and a vertical passing game, all things that should complement Fields’ skill set. That could lead to more rushing yards and an increase in big-play opportunities through the air." … But Fields isn’t the only QB with a new offensive play-caller we should be making note of. Perhaps this year, we’re also sleeping on Russell Wilson (HC Nathaniel Hackett), Kirk Cousins (HC Kevin O’Connell), Daniel Jones (HC Brian Daboll), Trevor Lawrence (HC Doug Pederson), Derek Carr (HC Josh McDaniels), Tua Tagovailoa (HC Mike McDaniel), and possibly a few others. The bull-case argument should be fairly easy for each player. (e.g. Russell Wilson leaves behind Pete Carroll’s archaic offense and is finally allowed to “cook.” Cousins rids himself of the slow-paced run-heavy Mike Zimmer-influenced offense he’s been stuck in for years, and O’Connell coaches him up to a 2021 Matthew Stafford-like season. Daniel Jones replaces the guy who called a QB-sneak on third-and-9 with the guy who made magic once before with Josh Allen. Trevor Lawrence replaces arguably the most laughably inept head coach in NFL history, with the guy who once made Carson Wentz look elite. Etc.)
On this point, we need to be careful not to underestimate (potentially brilliant) offensive-minded coaches and play-callers with a long track record of fantasy success. This has surely been the case with HC Sean McVay, who has produced a top-3 QB (by playoff win rate) in three of the last five seasons. And this was also likely the case with Patrick Mahomes in 2018 (ADP: Round 12). Of course, we were underestimating Mahomes’ natural talent, but also that of his coaching staff and supporting cast. After Alex Smith easily hit career highs and led the league in passer rating and AY/A, he was then promptly and unceremoniously traded away so that their Round 1 QB could flourish within the same offense. Anyway, all of this to say, Mahomes’ 2018 situation reminds me a bit of Trey Lance, who is playing alongside both an elite offensive genius in Kyle Shanahan and an elite supporting case.
QB Leaders by YPA [2018-2021]
— Scott Barrett (@ScottBarrettDFB) July 17, 2022
1. Jimmy Garoppolo (8.4)*
2. Deshaun Watson (8.3)
3. Patrick Mahomes (8.1)
...
12. Matthew Stafford (7.7)
13. Nick Mullens (7.7)*
...
17. Aaron Rodgers (7.6)
18. C.J. Beathard (7.5)*
19. Lamar Jackson (7.5)
*played for Shanahan's 49ers https://t.co/ueAIxktMXo
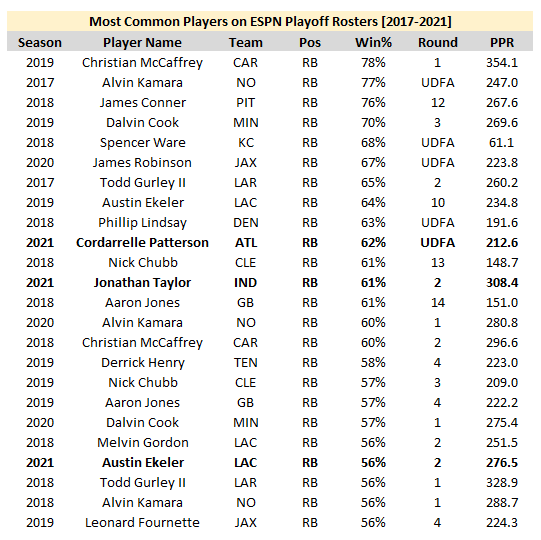
Running Backs
Positional Analysis
Like it or not, the running back position is THE most-important position in fantasy.
More so than any other position, running backs make up the far majority of any season’s league-winners. And, typically, you’re going to have to pay up to acquire them.
Excluding Spencer Ware — a late-season pick-up who only started two games — 43% of the running backs on our chart were drafted in the first two rounds. 65% were drafted in the first four rounds.
There were a number of UDFAs at the top of this list, but that isn’t necessarily an argument in favor of Zero-RB or against the value of RBs. Obviously it’s true that landing a starter-worthy RB off of waivers is a massive advantage, and such a luxury would benefit Zero-RB teams more than other teams. But this is still an incredibly rare event (at best, one “league-winning” UDFA RB per season), and your odds of acquiring such a player aren’t any better than that of any individual leaguemate, having to contend with waivers or FAAB. So, roughly, a 1/12 chance of landing the one valuable UDFA RB per season? Instead, the data strongly suggests grabbing at least two RBs in the first four rounds is the optimal approach — outside of UDFAs, 79% of league-winning RBs were drafted in the first four rounds.
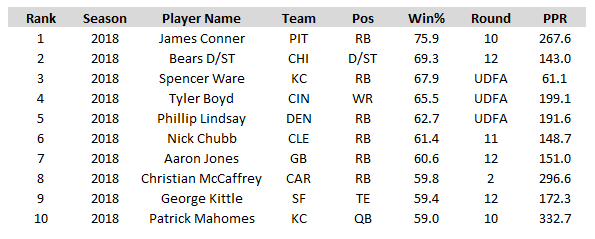
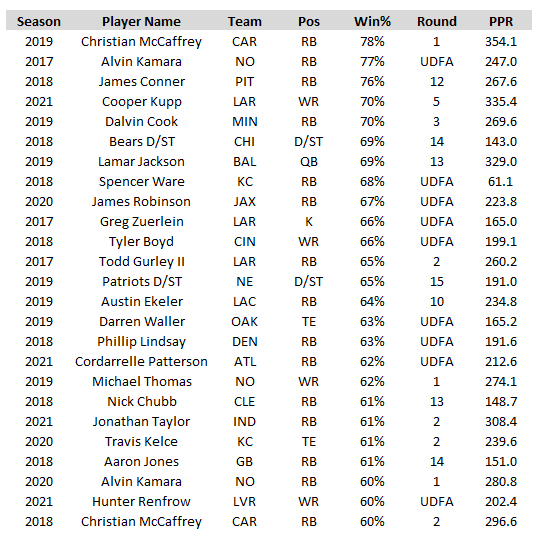
Again, running backs make up the far majority of any season’s league-winners. Over the past five seasons, 15 running backs scored a Win% of at least 60.0%. Over the same span, only four wide receivers, one quarterback, two tight ends, two defenses, and one kicker reached that threshold. (See below chart.)
Why is all of this so? Well, because of scarcity — as we keep saying. But also, because running backs are typically your highest-end producers. Over the past five seasons, 10 of the top-12 highest-scoring flex-eligible players (by FPG) were running backs.
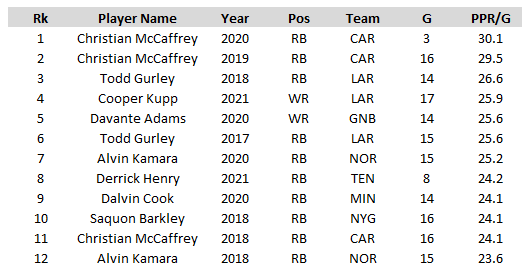
Balancing both points: Because highest-end RBs score the most points, and because RB is the scarcest position in fantasy, highest-end RBs are far-and-away the most valuable commodity in fantasy football. This is easily demonstrated by VORP (Value Over Replacement Player). As you can see below, RBs dominate this metric, comprising 11 of the top-12 seasons (92%) since 2010.
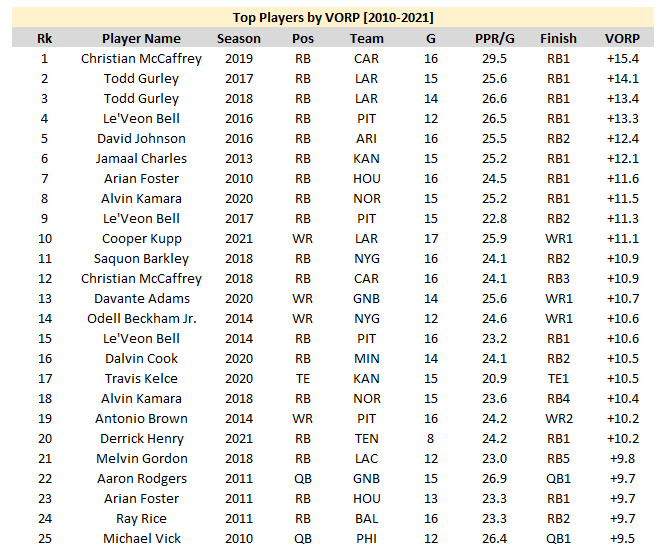
NOTE: In this instance “Replacement Player” is defined as “Worst Possible Starter." So, baselines are QB10, RB20, WR20, and TE10.
We like to think fantasy football is a battle of wits and skill — you win your league by winning your draft, and you win your draft by being better at predicting player outcomes than any of your other leaguemates. That’s mostly true, but, also, probably not as true as we would like to think. Rather, to me, it seems so much of your success or failure is dependent upon successfully (whether due to luck or skill) landing a top-3 fantasy RB in any given season.
So, should you go out of your way to draft at least two running backs in the first three rounds? Is ‘Zero-RB’ a suboptimal draft strategy? Yeah, probably.
Again, this is specific to ESPN standard leagues and to our data — which only goes back four seasons — but all of these assumptions have certainly held true over that timeframe. Leagues are won and lost at the running back position and league-winning running backs are typically only found early in your draft.
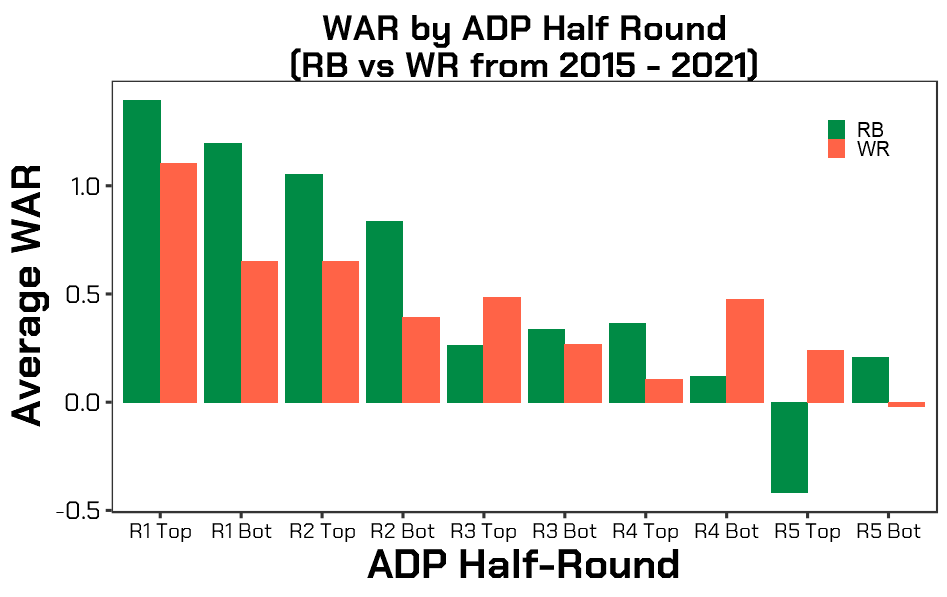
NOTE: All of the assertions made above are just as easily supported by Jeff Henderson’s work on WAR (Wins Above Replacement). Please see the below tweet thread:
.@Statholesports has done an excellent job -- through his work in fantasy wins above replacement (WAR) -- of showing why an RB-RB approach is optimal
— Scott Barrett (@ScottBarrettDFB) July 20, 2022
And why there is no Zero-RB "debate", you're just drafting suboptimally. (weird formats / best ball excluded)
[1/8]
Player Analysis

Excluding Spencer Ware (who will also be excluded for the remainder of this article), 11 of our top-12 running backs were entering their first, second, or third year in the NFL. On the full list, 23% of all RBs were rookies, 23% were sophomores, 23% were juniors, and 17% were seniors (or entering their fourth season in the NFL). Additionally, only 15% of this list is composed of players 26 years or older.
Again, this speaks to the same point we made with QBs — we want to be drafting ascending talents, and it pays to gravitate towards unknown commodities (the known commodities are already priced as such). But this is especially true of the RB position. Historically speaking, RBs are far more productive far earlier in their careers than any other position. Running backs also hit their peak years much more quickly (Years 2 and 3). And they also start to decline much sooner than any other position.
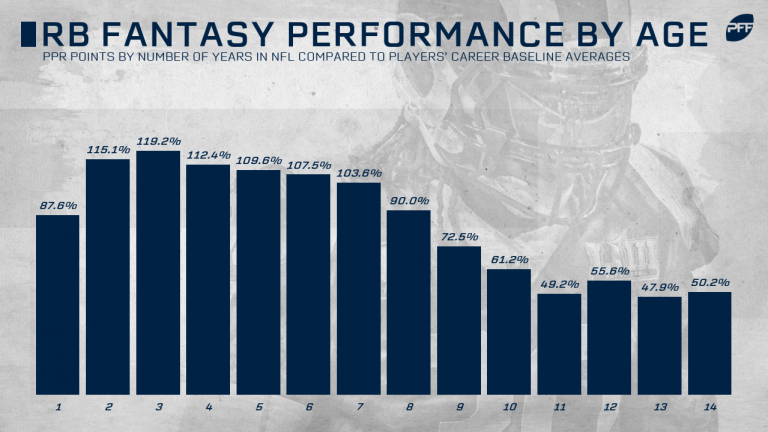
Source: PFF: “Aging curves: How years in the league impact flex players' fantasy potential”
Actionable Takeaway: It seems ADP has mostly caught up to this trend, but it’s possible we’re still sleeping on a few of these names. For instance, RBs typically see their production jump by about 31% from their rookie to sophomore seasons. That’s just about already baked in for Najee Harris (ADP: RB6) and Javonte Williams (RB11), but isn’t for Elijah Mitchell (RB23) or Rhamondre Stevenson (RB35). And we shouldn’t be surprised if a few other Year 1-3 running backs surprise with a league-winning season. As gross as this argument feels to make, I don’t know that the jury is fully out on Clyde Edwards-Helaire, and I wouldn’t be totally shocked if he follows Brian Westbrook’s career trajectory under HC Andy Reid… Additionally, it doesn’t appear as though ADP is over-valuing RBs approaching the age cliff (Year 8-10), as the only RBs who qualify and are being drafted in the top-15 rounds are Melvin Gordon (Year 8) and Cordarrelle Patterson (Year 10), who are already coming at a steep discount. (Though this could also be used to support Javonte Williams’ bull-case argument.)
Like with QBs, we also see a number of running backs making the list following a play-caller change: 2021 Austin Ekeler, 2019 Derrick Henry, 2018 Christian McCaffrey, 2019 Dalvin Cook, 2017 Todd Gurley, and 2019 Leonard Fournette. And I don’t think this is a coincidence.
The only difference between Ekeler’s 2020 season and his 2021 season was that he was no longer taken off the field inside the red zone; he was finally granted goal-line duties in addition to his otherwise extremely valuable bell cow-role. As a result, his touchdowns jumped from just 4 to a league-high 20, while handling 69% of the backfield XTD (up from just 28% in 2020) … Dion Lewis out-snapped Derrick Henry in 12 of 16 games in 2018 (under Matt LaFleur). It was hard to imagine Arthur Smith wouldn’t quickly remedy such an egregious blunder… For Cook and McCaffrey, the running back resumes of Gary Kubiak and Norv Turner should speak for themselves. And for McCaffrey, specifically, HC Ron Rivera and OC Norv Turner both promised a 100-150% jump in touches per game in 2018… Similarly, in 2017 Sean McVay promised reporters Gurley would be an every-down bell-cow heavily used in the passing game, and besides, it’s hard for any coach not to be a massive improvement on Jeff Fisher… OC John DeFilippo also promised a lot more passing work and a true bell-cow workload for Fournette in 2019, which eventually proved true. This brings us to our next point…
Perhaps we should pay more attention to what coaches are saying to us, rather than just immediately dismissing it as “coach-speak." In addition to Christian McCaffrey (2018), Todd Gurley (2017) and Leonard Fournette (2019), there are a number of instances where a breakout might have been more obvious had we only listened to a player’s coach and/or front office. Savvy drafters could have envisioned 16.5 FPG or more for a rookie-year Alvin Kamara based on the role GM Mickey Loomis was envisioning for him. In 2020, HC Doug Marrone told us James Robinson could play all three downs, and then later, that his stellar training camp played a role in the team’s decision to release Leonard Fournette. I’m sure there are other examples we can pull as well.
Actionable Takeaway: Whether negative or positive, keep your eyes peeled for similar quotes from head coaches or offensive coordinators, as we progress throughout the season. For instance, Chargers GM Tom Telesco told reporters he wanted to reduce Austin Ekeler’s workload in 2022, and then later drafted RB Isaiah Spiller in Round 4. Broncos HC Nathaniel Hackett said he plans on “feeding whoever is hot'' when it comes to deploying his RBs. (I don’t know about you, but, to me, Javonte Williams looks like Ana de Armas next to Melvin Gordon’s Queen Elizabeth.) By all appearances, Vikings HC Kevin O’Connell plans on using RB Dalvin Cook a lot more in the passing game. HC Matt Rhule "has made it clear Christian McCaffrey will continue to get his touches early and often." And although he has said this before, HC Zac Taylor told reporters he wants to give Joe Mixon more work in the passing game… And even without pollyannaish quotes to support them, some coaching upgrades should be viewed as glaringly beneficial to a player’s expectation (I’m looking at you Saquon Barkley). But the reverse can be true as well. For instance, Josh Jacobs finally assumed a bell cow-role last year, ranking top-5 in snaps, carries, and targets across the final seven weeks of the season. But new HC Josh McDaniels has always deployed a very muddied committee backfield.
The running back position is also the most volume-dependent position in fantasy. Therefore it’s no surprise that 78% of the running backs on our list ranked top-12 in weighted opportunity per game. And that’s even more impressive when we contrast that to only 83% of the running backs ranking top-12 in FPG. The outliers were 2021 Cordarrelle Patterson, 2019 Derrick Henry, 2018 Phillip Lindsay, 2018 Aaron Jones, and 2018 Nick Chubb. So, basically, two massive values relative to ADP (Patterson, Lindsay) and three of the league’s five best and most-efficient runners on the ground. For running backs, volume is far more important, sticky, and predictive than efficiency when it comes to scoring fantasy points, but that also doesn’t mean hyper-efficient running backs can’t surprise us every now and then. They’re just difficult to see coming — essentially, variance-driven outliers — and typically not good bets ex-ante.
On that point, some of these breakouts might have been borderline impossible to have seen coming in the preseason. Everything finally clicking for Cordarrelle Patterson in his *checks notes* ninth season in the NFL? Even back when he was going undrafted, James Conner was my No. 1 must-draft handcuff and a top sleeper, but even I never would have imagined Le’Veon Bell would sit out the entire season. Nick Chubb was always a bet on talent over opportunity, but surely you didn’t envision Carlos Hyde getting traded halfway through his rookie season. Nor could anyone foresee the Jaguars just straight up cutting Leonard Fournette following a 1,674-YFS season and then handing UDFA rookie James Robinson the identical role.
There are only 15 instances of a running back averaging at least 5.5 targets per game over the past three seasons (5 per season), but a whopping 12 of our 23 running backs averaged at least 5.5 targets per game (52%). That’s no coincidence — for running backs, targets are worth 2.5X as much as a carry in PPR leagues. This seemed to be a more important factor than gamescript, as 52% of the RBs on our list played on teams finishing above .500 (a far more frequent occurrence than RBs earning 5.5 targets per game).
Wide Receivers
Positional Analysis

Looking back at our running back chart, you’ll see 40% of our sample was drafted in the first two rounds. But in this chart, you’ll find that only 4 of the 29 wide receivers on our list (14%) were drafted in the first two rounds. Why? Because, again, the running back position is the most important position in fantasy. High-end running back production simply matters more than high-end wide receiver production, and if you’re drafting a wide receiver early, you’re not drafting a running back early (which is where league-winning running backs tend to reside).
In addition to fewer early-round names, you also see a larger number of UDFAs. And you see very few (only five) WRs selected in Rounds 7-16. Why is that? Well, because WR is definitely the second-most important position in ESPN leagues. And because ADP is probably a little better than we give it credit for. But also (I suppose because it’s the deepest position) don’t be surprised to find a gem off waivers early in the year. And the fact that you can — more often than any other position — helps drag down the value of the position overall.
Player Analysis
With running backs, 85% of our sample were age 25 or younger in their league-winning season. With wide receivers, only 52% of our sample was composed of players 25 years or younger. That makes some sense, as wide receivers do tend to break out later in their careers than running backs. Generally, a wide receiver’s breakout year and, actually, peak year is Year 3. Perhaps uncoincidentally, Year 3 was the mode in our data set; 28% of our sample, followed by Year 2 (24%), and then Year 5 (14%). And Year 3 also comprised 4 of the top-7 seasons on our chart.

Source: PFF: “Aging curves: How years in the league impact flex players' fantasy potential”
Actionable Takeaway: Should we be expecting a jump in production from sophomore wideouts Elijah Moore, DeVonta Smith, Rashod Bateman, and Amon-Ra St. Brown? Could third-year WRs Justin Jefferson, CeeDee Lamb, Tee Higgins, Michael Pittman, Gabriel Davis, Jerry Jeudy, or Darnell Mooney finish as one of the top league-winners of the 2022 season? Yes. Obviously, yes. The odds are very good and the ADP already reflects that. However, some sleeper-tier third-year WRs to consider may be: Brandon Aiyuk (ADP: WR43), Chase Claypool (WR50), K.J. Osborn (WR66), Van Jefferson (WR68), or KJ Hamler (WR78). Perhaps a 2018 Tyler Boyd or 2021 Hunter Renfrow-type season is within their range of outcomes. And perhaps a 2019 DJ Chark-like breakout may be coming for one of the following sophomores: Kadarius Toney (WR42), Rondale Moore (WR55), Terrace Marshall (WR88), Amari Rodgers (WR107), Tutu Atwell (WR121)… Toney is far-and-away my favorite of these names, but I have decent exposure to Jefferson and Rodgers in best ball leagues.
I think in the cases of Cooper Kupp (2021), Deebo Samuel (2021 — Jimmy G was hurt for most of 2020), and Adam Thielen (2018), we were underrating the impact of some obvious QB upgrades. And I wonder if we’re doing the same in 2022 with WRs on the Broncos, the Browns (depending on the length of Watson’s suspension), and the Saints. And possibly also the 49ers or the Colts.
62% of our WRs finished the season top-12 in FPG, though, only 45% finished top-12 by targets per game. And 41% finished outside of the top-20 by targets per game. Wide receivers, like running backs and tight ends, are heavily reliant on volume for fantasy points, but far less so than for running backs. On this point, Washington’s decision to draft Jahan Dotson could actually be beneficial for Terry McLaurin. His number of routes run would remain unchanged, and while he may see fewer targets, his efficiency should increase. Washington will likely be able to run more plays, more plays near the end zone, and he’ll face softer coverage from opposing defenses.
While efficiency outliers (a.k.a. regression candidates) should be avoided at the running back position, that’s not entirely true for wide receivers. The efficiency numbers aren’t repeatable, but high-efficiency seasons do tend to lend themselves towards more volume in the following year, as I proved here. We also saw this play out in our data. Among all 23 WRs on this chart with 50-plus targets in back-to-back seasons… 39% of our WRs ranked top-12 in fantasy points per target in the season immediately preceding their league-winning year. In their actual (league-winning) season, only 26% ranked top-12. What’s the takeaway here? Volume is more important than efficiency in fantasy, but efficiency can also do a pretty good job of predicting a future increase in volume.
Actionable Takeaway: Might Allen Lazard (5th in fantasy points per target last year), Byron Pringle (10th), Brandon Aiyuk (13th), Christian Kirk (15th), or Gabriel Davis (16th) be in line for more volume and a breakout season this year? I think it’s very possible, and have heavy best ball exposure to many of these names to back it up.
Roughly 45% of the players on our list are slot, rather than outside, receivers. Over the same span, only 31% of any season’s fantasy WR1s were slot receivers. It’s not obvious to me why, but perhaps fantasy drafters do tend to underrate slot receivers by ADP. Perhaps because they’re so much less important than outside receivers in real life.
Our final point is an obvious one — you want WRs on teams with a potent passing attack. Within our sample (but minus UDFAs), 38% of our league-winning WRs were on teams ranking top-5 in passing YPG, 67% were on teams ranking top-12, and only 14% were on teams ranking bottom-12. (Due to the power-law effect, some teams are capable of supporting as many as three starting-caliber fantasy WRs, while many more teams aren’t capable of supporting even one.) On this point, maybe it’s a little weird that Kansas City (top-5 in passing YPG for four straight seasons) only has one WR being drafted in the top 8 rounds. That the highest-priced WR on Green Bay (top-10 in 3 of the past 4 seasons) is going in Round 7. And that Dallas ranks top-3 in passing YPG in two of the last three seasons, but their WR2 is being drafted in Round 10. From these teams, I really like Marquez Valdes-Scantling (ADP: WR44), Allen Lazard (WR39), and Jalen Tolbert (WR67) at current ADP.
Tight Ends
Positional Analysis
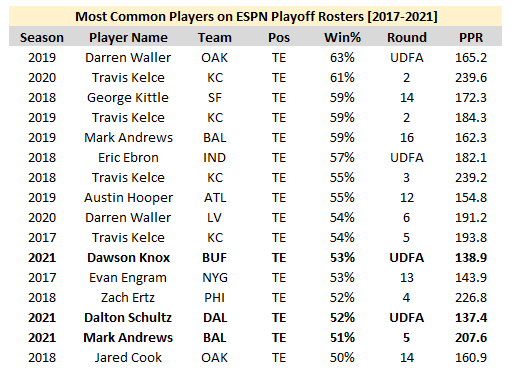
What immediately jumped out to me was how obvious this list looks both pre- and post-hindsight. Incredibly, 18 of the 19 TEs on this list finished top-6 in FPG, with Dalton Schultz (2021) being the lone exception.
Basically, all of the names on this list are all of the names you’d expect to see.
Even pre-hindsight many of these players were pretty obvious. Mark Andrews was my top tight end sleeper in 2019 and Darren Waller ranked right behind him. In 2018, George Kittle was Graham Barfield’s top sleeper, and Eric Ebron was John Hansen’s top sleeper. Add in Travis Kelce, who made the list four times and that’s almost half of the list.
Beyond that, ADP formed a near-perfect U-shaped parabola: 53% of our list was selected in the final five rounds of the draft or not at all, while the other 47% had an ADP in the first six rounds. Incredibly, zero league-winning TEs were drafted between Rounds 7-11. And I think this all points to the optimal approach when drafting tight ends; go big or go home — target a premium tight end in the early rounds or wait at the position.
And this certainly follows the macro environment we’ve witnessed over the past five seasons. Which is to say, it appears we’ve now seen the death of the middle class within the TE position. Instead, it’s become a position dominated by only 3-4 “Oligarchs” ruling over a high number of “Peasants." And therefore those “Oligarch TEs” should be viewed as a fantasy cheat code — much like Konami Code Quarterbacks, except even more valuable.
That’s because TE production is far more top-heavy, while QB production is fairly flat across the top 50% of the spectrum (at least historically). For instance, over the past five seasons, the TE2 out-scores the TE5 by 37%. That’s a greater gap than between the TE5 and TE16, and even the QB2 and QB16!
Although nearly all of our TEs finished top-six in FPG, you don’t necessarily need an elite TE to win your league. TE is the third-most valuable position in fantasy, but on the whole, is still probably closer to QB and defense in terms of value (than RB and WR). Over the past five seasons, there have been 62 instances of a player finishing with a Win% of 55.5% or higher. Here’s how that composition shook up:
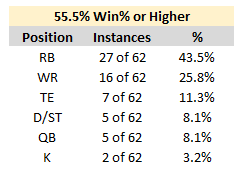
One might argue, based on these numbers, that high-end RBs are worth roughly 1.7X as much as high-end WRs, which are worth roughly 2.3X as much as high-end TEs, which are worth roughly 1.4X as much as high-end QBs (which are worth the same as high-end defenses). Or, rather, high-end RBs are worth roughly 1.7X as much as high-end WRs, 3.9X as much as high-end TEs, and 5.4X as much as high-end QBs and defenses.
At the very least, this has literally been true of league-winners (defined as narrowly as we have, but which can be used somewhat interchangeably with “high-end producer relative to price”) over the past five seasons. And the values here do seem to follow what we’d naturally expect based on Harstad’s back-of-the-napkin math on positional scarcity.
Add it all up and the optimal TE strategy becomes even more obvious. Ideally you walk out of your draft with a “Oligarch TE." Ideally. But there’s a cost (the opportunity cost in passing up a similarly-priced RB or WR) and a risk associated with that (the TE you thought would be an oligarch may actually be a peasant), and waiting at the position (or “punting it”) has been surprisingly effective — at the very least, far more effective and viable than for RBs and WRs.
Over the last five seasons, ADP has been vastly more accurate at predicting player performance from the TE position (0.30 r-squared) than for QBs, RBs, or WRs (0.08-0.12 r-squared). But that’s mostly due to the Oligarch TEs (and primarily Travis Kelce) being such strong and safe bets for fantasy. But our sample data clearly showed that the TE position offers an inordinately high number of late-round league-winners. Remember, over half of our list was selected in the final five rounds of the draft or not at all (ADP: TE12 or later), and the rest were all top-5 picks at the position. Rounds 6-11 (ADP: TE6-11) produced zero league-winning TEs. So, view that as the “Dead Zone” to avoid. If you miss out on a potential “Oligarch," don’t sweat that too much and load up on some high-upside late-round sleepers instead. It will feel gross, but such a strategy may offer more upside to your team as a whole.
Player Analysis

Without question, Travis Kelce has been one of the most underrated players in fantasy for a number of years now. He’s the only player to post a “league-winning” season (>45% win-rate) in each of the past five seasons. Tyreek Hill is the only other player to do this more than three times. He owns the 2nd-, 4th-, 7th-, 10th-, and 19th-best TE seasons (by win-rate) within our sample, and that’s despite the handicap of an ADP perpetually within the range you typically want to be drafting RBs. Again, Kelce cracked the 45% win-rate-barrier in all five seasons. But over the last five years, there’s typically only 0.6 Round 1 and 0.6 Round 2 WRs who qualify per season.
Over the past six seasons, Kelce has finished 2nd, 1st, 1st, 1st, 1st, and 1st among TEs in fantasy points scored. Among all WRs, he would have ranked top-10 in fantasy points in each of the last five seasons. Just two years ago he averaged the most FPG by any TE in any season all-time (20.9), and, among wide receivers, would have ranked behind only Davante Adams and Tyreek Hill. By VORP (Value Over Replacement Player), it was even more obvious he’s long been worthy of a first-round pick in 12-team leagues, finishing (among all players) 8th (last season), 2nd, 6th, 11th, and 12th. Or, versus wide receivers: 4th, 1st, 3rd, 3rd, and 3rd. And now Hill leaves behind 159 targets in his wake… All this to say, I think I’d take Kelce over any WR not-named Cooper Kupp.
2019 Darren Waller was another instance of us underrating coach-speak. HC Jon Gruden said all offseason, Waller was one of the NFL’s “best-kept secrets” and would be given “the chance of a lifetime” as Oakland’s TE1. Just the year prior, in Oakland, Jared Cook finished top-five in total fantasy points. We already brought this point up with running backs, though Patrick Mahomes (2018) and Chris Godwin (2019) also qualify at the other positions.
There were two sophomore TEs within the top-5, and, like with QBs, I don’t think that’s too surprising. Tight ends typically make a massive leap from their rookie to sophomore seasons. And it probably shouldn’t be too surprising who these two sophomore tight ends (specifically) were George Kittle and Mark Andrews. (Evan Engram was one of the all-time great outliers, but typically, rookie tight ends rarely finish as fantasy-relevant contributors.) Although, as rookies, Kittle and Andrews weren’t dependable options for fantasy, both did post historically great rookie seasons, finishing with 500-plus receiving yards — something only 17 other tight ends have accomplished over the past 30 seasons. Obviously, this bodes extremely well for Kyle Pitts (his 1,026 receiving yards was +132 more than any other rookie TE over this span) and Pat Freiermuth (who fell just 3 yards shy of the 500-mark).
Defenses
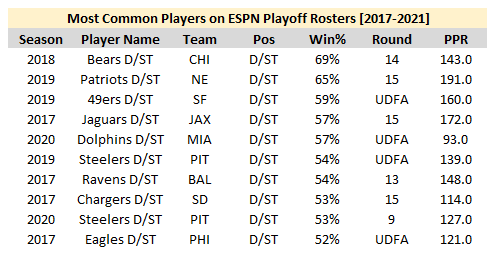
If just looking at Win% you might think that top defenses are worth just as much as the top quarterbacks. And, well, that’s probably technically true, but not practically true.
We need to be thinking about positional value as a sort of three-legged stool. (Or, at least that’s what Adam Harstad told me here.) One leg of the stool is ‘scarcity.’ Another is ‘replaceability,’ or how valuable a player is over his peers (think VORP). The third leg is ‘predictability.’ The stool (value) needs all three legs to stand.
Team defenses are just as scarce as quarterbacks and rank similarly in in-position scoring differential, but they are far less predictable. Since 2015, the odds of a defense being drafted in the top-5 (by ADP) and actually finishing in the top-5 (by FPG) is only 14%. Contrast that to tight ends at 51% and wide receivers at 49%. But while defenses are massively unpredictable if projecting full season production in the offseason, team defense scoring is very predictable in-season in any given week. I talk about all this in further detail here.
And because team defense is low-scarcity and highly predictable week-to-week, your “replacement player” should actually be a lot higher than D/ST10. By streaming defenses week-to-week, you should easily be able to cobble together a floor of about D/ST6, and a ceiling well beyond that, as I did here. And, realistically, that’s the route you should go (streaming the position), as opposed to wasting valuable draft capital at the position.
In my own leagues, I’m typically not even drafting a defense, unless I’m drafting very close to the start of the season. Instead, I’ll draft a high-upside player in the final round like Hassan Haskins (RB65), Eno Benjamin (RB67), or Tyler Badie (RB72) / Mike Davis (RB74). If Derrick Henry, James Conner, or J.K. Dobbins were to suffer an injury in the preseason, this late-round RB could be a weekly RB2 or better — a much greater advantage than owning a top team defense. If that happens, I’ll drop a different player and add a defense right before Week 1.
Playoff Rosters vs. Championship-Winning Rosters

How much overlap was there between these two charts? Very little — only 11 of 30 overlapping player seasons. As for why this is, this goes back to the point made in our introduction. Fantasy postseason performance is far more a function of volatility than fantasy performance in the regular season, which is far more a function of skill.
By playoff win-rate, we find only 4 (of 30) league-winners coming in Rounds 3-11. That’s eerily similar to our chart of the right, showing only 4 league-winners from Rounds 5-13. In other words, only 18-20% of all non-UDFA league-winners were drafted in these 9 rounds (53% of all rounds).
Is this a “dead zone?” Why is the middle-bulk of the draft so under-represented by our data? Truthfully, I’m too sure. It’s a little weird. But my theory is: obviously, it’s harder to be a league-winner with a more expensive ADP. The players who were able to rise above it, were truly dominant (power law players), sometimes posting historically great numbers. And the players capable of posting such numbers are typically known names, and only found at the top of your draft. Whereas middle-round players wholly lacked that upside, as did the later-round players (who, in a best-case scenario, would only be capable of production similar to that of the best middle-round players). It’s just that the later-round players had less of a hurdle (their cost) to clear. In comparison, players drafted in Rounds 1-4 made up 64% of all non-UDFA championship winners. And I wonder if these two points in conjunction speak to the notion that “you can’t win your draft in Round 1. But you can lose it in Round 1.” Except maybe it’s more like “You can win your draft in the first 4 rounds, and you can also lose it in the first 4 rounds. Really, the first 4 rounds matter exponentially more than all subsequent rounds, and those rounds are probably the determining factor over whether or not you’ve won your league..”
What do these two charts tell us about positional value? Among the top-30 most common players on playoff rosters, we see 3 quarterbacks, 13 running backs, 5 wide receivers, 5 tight ends, 3 defenses, and 1 kicker. Among the top-30 most common players on championship-winning rosters, we see 1 quarterback, 13 running backs, 11 wide receivers, 3 tight ends, 1 defense, and 1 kicker.
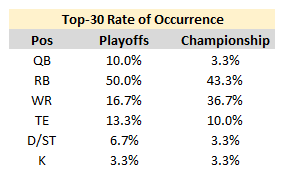
Again, running backs are typically your league winners, followed by wide receivers. But it’s important to highlight the fact that WRs clearly gained significant ground on RBs when looking at championship-winning rosters. What that’s suggesting, I think, is that because WRs offer a higher weekly ceiling, they become more important and more valuable throughout the playoff weeks. You really need those spike weeks in order to – not merely to avoid defeat, but rather to – use the volatility inherent to the playoff format to your advantage; to take down potentially better teams as an underdog on your way to a Championship title.
But to argue back against Zero-RB, there were only 4 UDFA RBs to crack the list on the right (less than one per season). You’d think there would have been more, considering how Zero-RB adherents argue a key advantage to the strategy is the frequency at which high-end RBs suffer injuries late in the season resulting in an influx of cheap (late-round or UDFA) RBs who then dominate in the fantasy playoffs. But our data doesn’t bear that out. And neither does our supplementary data. Indeed, there were exactly as many Championship-winning UDFA WRs (4) as RBs (4), and UDFA WRs Amon-Ra St. Brown (2021), Breshad Perriman (2019), and A.J. Brown (2019) all ranked above any UDFA RB by win-rate.
And with that in mind, our previous concession to WRs gets negated when factoring in ADP. Among non-UDFAs, 8 of our 9 Championship-winning RBs were drafted in Rounds 1-2. Meanwhile all 7 of our non-UDFA WRs were drafted in Rounds 3-8.
It’s true that WRs have a higher weekly ceiling than RBs, but that doesn’t necessarily diminish the RB-RB argument. Because WR spike weeks can typically be had at a much cheaper cost than for RBs. You need power law scores from RBs and WRs in order to progress throughout the playoffs. For WRs, many of those scores come from players selected in Rounds 5-10. But for the RB position, those scores typically only come from those selected in Rounds 1-2.
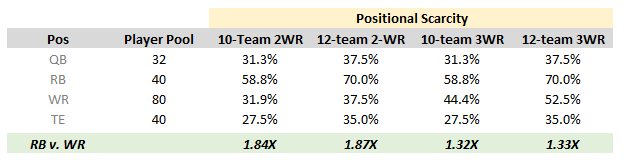
As a sort of forced conclusion to this piece, I’d like to remind the reader that this article had a very narrow scope – 10-team ESPN leagues. If you were in a 12-team league, but the same style-format, things wouldn’t change too much in terms of scarcity based positional value. Actually adding additional teams means RBs become more scarce relative to WRs. However, if you added a third starting WR – which is becoming increasingly common – WRs do gain ground, though RBs still come out well ahead. Here’s a quick graph to show what I mean (based on Adam Harstad’s logic here):
Beyond that, I would like to point the reader back towards “Upside Wins Championships.” Just about everything we’ve discussed in today’s article is fully supported or enhanced by all of the arguments made in that piece.
In fantasy, there is basically no difference between the:
— Scott Barrett (@ScottBarrettDFB) July 24, 2022
-QB10/QB18
-RB20/RB30
-WR50/WR600
-TE7/TE16
Low-end RB2 production is borderline worthless.
If I'm drafting the TE10 it's based on odds of a top-3 finish. TE8 production doesn't move the needlehttps://t.co/yUfLj9JZmh


