
Who was the best fantasy football player of 2020? Was it Josh Allen, who scored the most points by any player at any position? Was it Alvin Kamara, the early first-round pick who led all RBs? What about Travis Kelce, who outscored the #2 TE by over 50 points? You might think there is no way to tell for sure and “to each their own.” Think again.
I’m here to introduce a new statistic called Wins Above Replacement (WAR) for fantasy football, and it directly answers this question. WAR is a fine-tuned tool capable of controlling for everything imaginable that reveals the estimated number of wins each and every player provided the average fantasy team in a given year.
WAR was built to power redraft managers on draft day. When you sit down to make each selection this August, you should have one question on your mind: “Who is going to give my fantasy team the most wins?” That’s it. Nothing else matters. Of course, there’s no way to tell for sure which specific player will provide the most wins for your team. But with WAR, you’ll have the almanac at your hands revealing what the optimal draft looked like for 2020. This in turn will help you make key decisions for your 2021 selections.
I wrote an in-depth account on the concept of Wins Above Replacement prior to the 2020 season with Dynasty Nerds. This year, I added a key variable to perfect the model: weekly player start/roster percentage data from ESPN. Using the swaths of leagues housed by ESPN, it becomes very easy to generalize which players would be considered starting caliber on a weekly basis, resulting in a more accurate WAR model. In this introductory series, a thorough explanation of this updated model will be explored in the following three parts:
- Wins Above Replacement Theory
- Positional Hierarchy
- Year-Over-Year WAR Trends
Part 1: Wins Above Replacement Theory
WAR was originally created as a baseball statistic in the 1980s to estimate the number of wins a baseball player provided his team in a given year by controlling for everything else around him. The core concept is the same for fantasy football. WAR will tell fantasy managers how many more head-to-head matchups they should expect to win in a season from starting a particular player vs. that player’s expected replacement-level fill-in.
In order to make this happen, specific information on the following will need to be established in order to convert this baseball sabermetric to the fantasy football world:
- League Settings
- Average weekly team score
- Average team standard deviation
- “Replacement Level” Definition
- Player of focus
We’ll go through each of these points of emphasis in this article and finish it off with WAR results for 2020.
#1 League Settings
To keep things generalizable to all, the most common league settings will be presumed for this explanation. However, the model can be adjusted to suit basically any playing format. For this WAR statistic, there are traditionally nine players in each team lineup for a head-to-head matchup. We’ll consider the starting lineup to consist of QB, RB, RB, WR, WR, TE, Flex, DST and K in a 12-team league using half-point PPR.
#2: Average Team Weekly Score
The average team weekly score is calculated by adding the individual scores of all nine starting positions together. In order to assign an average score for each starting roster spot, we’ll use the average points from the top-12 (24 for RB and WR) highest-percentage started players of each week, according to all ESPN hosted leagues, across all 16 weeks.
Take QB for example. Each league in our sample has 12 starting QBs per week and 16 total weeks in a season. This means there are 192 starting QB outputs for a 12-team league. The 12 most-started QBs according to ESPN in each week make up these 192 performances, which are simply averaged to provide the expected fantasy points from an average starting QB.
This process is repeated for TE, DST and K. Since RB and WR have two starting slots, the average points from the top-24 started per week is used, doubling the amount in the pool as single starting positions. The process is the same for flex as a single starting position, except that all players considered a starter in their native position (RB, WR, TE) are not eligible for flex, as it’s presumed these players already occupy a starting spot somewhere in the league. However, the next top-12 most-started combination of RB, WR, and TE for each week do qualify. As explained with QB, the 192 weekly outputs from the 12 flex qualifiers across 16 weeks are averaged, producing this tricky position’s expected weekly points.
Simply adding all nine positional averages from this process together produces the expected amount of points the average team in a 12-team half-point PPR league for any given week. For 2020, that turned out to be 112.43.
#3 Average Team Standard Deviation
The process of determining the average points produced from each individual starting roster spot is performed the same for standard deviation. The only difference is that the standard deviation is calculated on these positions instead of the average. But the process for determining the team-level standard deviation is more complex and requires each individual position’s standard deviation plugged into the following formula:
Sqrt(QB_sd^2 + RB_sd + RB_sd^2 + WR_sd^2 + WR_sd^2 + TE_sd^2 + Flex_sd^2 + DST_sd^2 + K_sd^2)
To briefly explain the equation above, each individual starting position’s standard deviation is squared and added together inside the parentheses and the square root of the resulting figure provides the team-level standard deviation of the average team. For the average team in 2020, the standard deviation turned out to be 21.62.
In plain terms, this means that about 68% of fantasy team weekly scores fell between 21.62 points below or above the league average of 112.43. The idea that about 70 percent of weekly team scores in half-PPR leagues were between 90 and 134 seems about right. And if stretched to two standard deviations, 95 percent of team scores fell between 69 and 155.
Why does knowing team-level standard deviation matter for Wins Above Replacement? In order to ultimately estimate the likelihood that any individual player will lead your team to win a head-to-head matchup, the distribution of possible outcomes expected from your opponent must be known. We’ll come back to this soon.
#4 Replacement Level Definition
The most critical piece of the WAR puzzle is to determine how valuable a replacement-level player at each position is. But first, we need to figure out what replacement exactly means. The idea of a replacement player is that if you have a starting player miss a game due to injury, suspension, bye, etc., you are forced to insert your next best option into your starting lineup. This would either be someone on your bench or from the waiver wire/free agent pool.
Let’s draw this out with QB. In a 12-team league, WAR assumes the top-12 league started QBs from ESPN’s data are in one of the twelve team’s lineups. Sure, your league won’t likely match up 100% with the average of the masses, but this is the best estimate.
Let’s say your QB is on bye and you either have to either stream or use a backup. The question is: how many points can you expect out of the “next-best” QB? To figure this out, we need to find the average of the next top-12 started QBs after all determined league starting QBs for each week. We use the top-12 per week because we can’t assume our team will have the best replacement-QB in our league or the worst, so we use the average. All in all, 192 performances (12 per week * 16 weeks) for replacement-level QBs are averaged revealing the estimated points from a replacement-QB.
The process is the same for all positions, with the exception that twice the amount of starters are removed from consideration for RB and WR, due to the fact that each has two starting roster spots. From there, each position has a figure for what is estimated out of a replacement-level player. Here is what each position’s expected weekly points out of a replacement turned out to be in 2020:
| Pos | XFP |
| QB | 16.5 |
| RB | 7.8 |
| WR | 9.5 |
| TE | 6.9 |
| DST | 6.9 |
| K | 7.6 |
These figures will be used at the end of the next section to compare any player against at his position as the final step in the WAR process.
#5 Player of Focus
Now comes the fun part. We are ready to use all this information to calculate a player’s WAR. Let’s look at WAR’s No. 1 player in 2020 – Alvin Kamara – as our example. The idea is to figure out the odds the average fantasy team has of winning each matchup when all that is known are the points the player of note (Kamara) provided throughout the year.
In Week 1 of 2020, Kamara scored 21.2 fantasy points, which happened to be 7.7 points more than an average starting RB’s 13.5. Since we are specifically interested in focusing on Kamara, the rest of the eight starting positions on our team are expected to perform to league average as earlier explained. With the average expected points of all other starting roster spots on our team added together along with Kamara’s 21.2 points, the Kamara owner would expect to have scored 120.1 points in Week 1 without knowing anything about any other player.
Now we need to know what to expect out of the Kamara owner’s opponent. This is done by adding the average contribution of each position to obtain the expected team output: 112.4.
Here’s what this all looks like on paper so far:
Week 1 Expected Performances
| Opponent | Team with Kamara |
| QB: 21.37 | QB: 21.37 |
| RB: 13.5 | RB: (Kamara) 21.2 |
| RB: 13.5 | RB: 13.5 |
| WR: 13.2 | WR: 13.2 |
| WR: 13.2 | WR: 13.2 |
| TE: 9.7 | TE: 9.7 |
| Flex: 10 | Flex: 10 |
| DST: 9.7 | DST: 9.7 |
| K: 8 | K: 8 |
| TOTAL: 112.4 | TOTAL: 120.1 |
Notice that all expected scores are the same for each position on both teams with the only exception being Kamara’s 21.2. This gives the Kamara owner an expected eight-point advantage over the average fantasy opponent.
There’s one problem here. We can’t just assume with 100% certainty that Kamara led our team to victory in Week 1 simply due to the higher projected team total. This is where the team-level weekly standard deviation formula comes into play. Maybe our opponent does score exactly 112.4 points; but maybe they score 120 – or only 92. As any fantasy player knows, it’s going to vary week to week.
To account for this variance, a cumulative distribution function takes the average opponent expected score (112.4) and the average team standard deviation (21.62) and determines the likelihood of a score in this presumed normal distribution being below our team’s expected score of 120.1. And for Kamara in Week 1, this turned out to be 64%. Simply put: Without knowing the results of any other player than Alvin Kamara in a head-to-head matchup for Week 1, Fantasy players had an estimated 64% chance of winning the matchup after scoring 21.2 points.
The same process is repeated for all 16 weeks which provides estimated win percentages for all 16 matchups. For Kamara’s bye-week, the expected output of a replacement-level RB (7.8 points) is used to fill in his stead. The same method is applied for any player who missed a game for any reason, acting as a perfect way to deal with handling the impact injuries have on a player’s value. Once all 16 expected fantasy team win percentages are calculated for the Kamara owner, the seasonal fantasy team win percentage is simply the average of all 16 weeks.
Here’s each week’s results and seasonal average for Kamara owners in 2020.
| Week | Points | Team Win% |
| 1 | 21.2 | 63.8% |
| 2 | 33.9 | 82.6% |
| 3 | 38.2 | 87.2% |
| 4 | 19.4 | 60.6% |
| 5 | 15.9 | 54.3% |
| BYE | 7.8 | 39.5% |
| 7 | 18.8 | 59.6% |
| 8 | 20.8 | 63.1% |
| 9 | 13.4 | 49.7% |
| 10 | 31.3 | 79.4% |
| 11 | 10.5 | 44.4% |
| 12 | 5.7 | 35.8% |
| 13 | 16.7 | 55.8% |
| 14 | 18.9 | 59.7% |
| 15 | 16.9 | 56.1% |
| 16 | 54.7 | 97.1% |
| 2020 Average WP | 61.8% |
Now we know fantasy managers in 12-team half-point PPR leagues could expect to win about 62% of their games (9.89 out of 16) solely due to the contribution of Alvin Kamara. This is great and all, but we still need to figure out how much better this is than a replacement-level RB. The 39.5% odds provided by a replacement-level RB is multiplied by the total amount of games in a season (16), resulting in an expected seasonal win total of 6.32 / 16. Finally, this 6.32 wins expected with a replacement-level RB are subtracted from the Kamara owner’s 9.89, leaving us with Alvin Kamara’s official wins above replacement figure for 2020: 3.57.
And that is it. That is the full process to complete a fantasy football player’s WAR. Everything is simply repeated for every player until all relevant names are crunched and a full list of the most important players emerge.
Full 2020 Results
Below is the hindsight optimal draft position each of the top-60 fantasy players ended up being worth according to WAR. This reveals not only the ranking of the best players, but the degree of difference separating each:
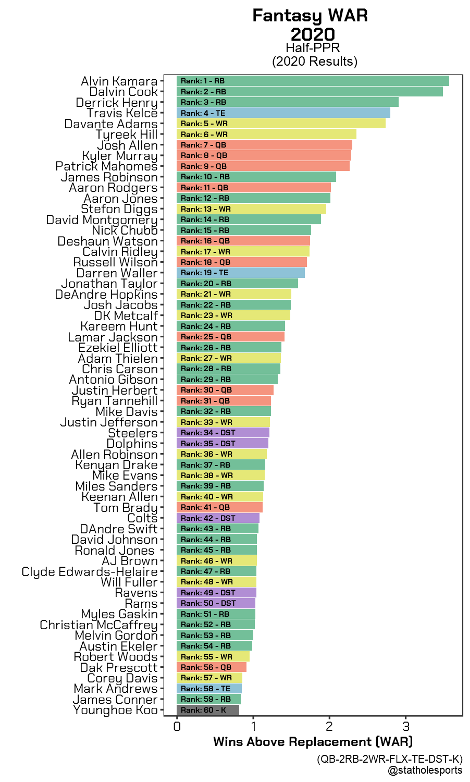
This is what the first five rounds of a 12-team draft would look like if the best possible player was taken in each selection in 2020. But, just like any investment commercial will tell you, past performance is no predictor of future performance — at least, not at the player level. Between injury, changes in team roster, coaching, schedule, etc., there’s too much randomness to use this graph to say any player who was better in 2020 will also be better in 2021. But what the graph can do is give you a starting point for player evaluation and give you a better sense of how to compare RB apples to WR oranges.
But WAR offers more than just plotting the prior season performance turnouts on a player level. An added use case for this metric is to evaluate on the position level instead of the player level. You’ll never be able to hit on all the right individual players all the time, but if you know which positions to invest heavier in, you’ll be a half-step above the rest of your league.
In the next installment, we’ll zoom out of viewing WAR on an individual player level and evaluate WAR on the position level. Now that WAR has solved comparing unlike positions in a standardized manner, we can evaluate the two most common strategies come draft day: “Bell Cow or Bust” and “Zero-RB.” You’ll come away knowing which of these popular strategies is most worthy of going to WAR with.


