Last season, in Week 8, Tyler Lockett caught all six of his targets for 100 yards, while D.K. Metcalf managed a measly 13 yards on three catches. And still, Metcalf actually out-scored Lockett, 16.3 fantasy points to 16.0. The difference? Touchdowns.
Clearly, touchdowns – worth 60 yards or six catches – are extremely valuable in fantasy football, but touchdowns are also rare events, mostly random, and extremely hard to predict. At each position, touchdowns were far less sticky (showing a much lower correlation year-over-year) than targets, receptions, carries, or yards. We also know that players who ranked highly in touchdowns in one year tend to regress closer to the mean in the following season.
Over the past decade, there have been 135 instances of a flex-eligible player recording 10 or more touchdowns in a single season. Of those instances, only 11% saw an increase in touchdowns the following season, and, on average, each player lost about 5.3 touchdowns from their prior-season total.
So, we know touchdowns are extremely important for fantasy football but extremely difficult to predict. And because so many people just draft off of last year’s results, we know it’s valuable to pinpoint looming touchdown regression candidates for fantasy. But what’s the best method for evaluating this?
A player’s talent does play a small role in scoring touchdowns, but for the most part, touchdowns are merely a function of a player’s opportunity. The more opportunities you receive and the more opportunities you receive closer to the end zone, the more likely you are to score a high number of touchdowns. And red-zone metrics, though frequently cited, aren’t a very good measure of near-end-zone opportunities, nor are they very good at predicting touchdowns. Why? Because, let’s say with red-zone carries, you’re grouping carries from the 1-yard line (53.8% chance of scoring) in with carries from the 17-yard line (3.6% chance of scoring) and treating them the same. A much better stat would weight each carry (and target) at each yard line by the actual degree of scoring probability.
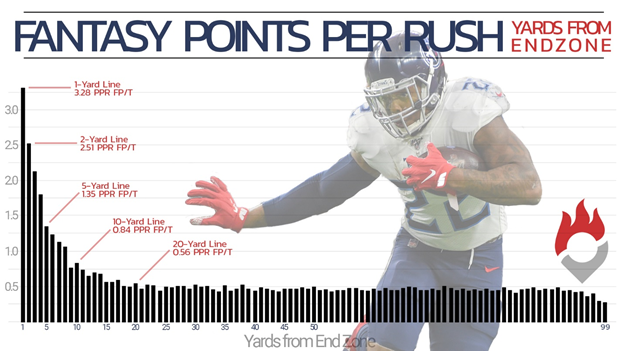
Mike Clay first came up with this idea in 2013, and created a metric called oTD to improve upon red-zone metrics as a predictor for touchdowns. With Clay’s oTD as the inspiration, I attempted to calculate expected touchdowns (XTDs) using a similar methodology to Clay’s. Basically, I’m looking at each carry by distance from the end zone (and weighting each carry according to the average scoring rate on all identical carries over the past decade) and looking at each target by distance from the end zone and depth of target (and weighting each specific target based on the average scoring rate on all identical targets over the past decade). The sum of these numbers gives us a player’s total expected touchdowns, or how many touchdowns we should expect a perfectly average player to score on an identical workload. We can contrast this with a player’s actual touchdown total to measure how lucky or unlucky they were in a given season.
After testing this, I found this stat – expected touchdowns (XTD) – to be even stronger at predicting touchdowns in the following season as raw touchdowns (0.283 to 0.275 r^2) and far stickier year-over-year (0.382 to 0.276 r^2).
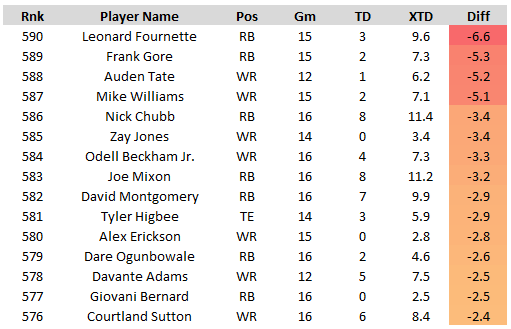
Of the top-25 seasons by (positive) touchdown differential this past decade, only one player scored more touchdowns in the following season, and on average players saw their touchdown total decline by 53% in the following season. Of the bottom-25 seasons (worst touchdown differential), 19 of 25 improved in the following season, and, on average, by 66%. As you can see, clearly, at the polar extremes, a massive touchdown regression is extremely likely (hello Derrick Henry, Aaron Jones, Leonard Fournette).
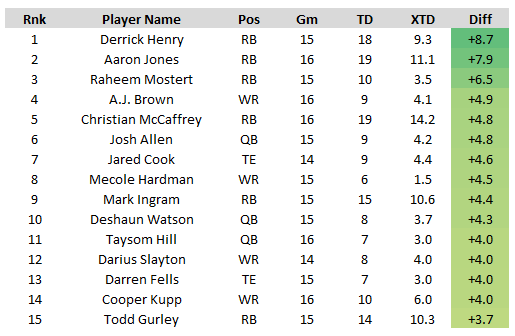
Without further ado, by contrasting expected touchdowns with actual touchdowns, here are the players most likely to regress in the touchdown department next season.
Top Regression Candidates
Derrick Henry, RB, Tennessee Titans
XTD: 9.3, TD: 18, Diff: +8.7
Sneaky Stat: Last season Frank Gore received more opportunities inside the five-yard-line than Henry (11 to 10), and yet, Henry finished with 16 more total touchdowns. Leonard Fournette received more opportunities inside the 10-yard than Henry (23 to 21), and yet, Henry finished with 15 more total touchdowns.
Last season, after Ryan Tannehill took over for Marcus Mariota, Henry was an unstoppable juggernaut both in real NFL and fantasy terms. He averaged 5.98 YPC and 25.0 FPG over his final 10 games (including the postseason), exceeding 23.5 fantasy points in 8 of those 10 games. For perspective, only 13 running backs have ever averaged 25.0 FPG in a single season.
Henry was no doubt phenomenal last season. And he might be the best pure runner in the NFL. But still, with a first-round price-tag (ADP: 1.08), he’s also someone I won’t ever be drafting in PPR leagues. As we showed in “Anatomy of a League-Winner,” we want to chase volume at the running back position, and not be seduced by efficiency-based outliers (which almost always regress to the mean).
And that’s exactly what Henry was last season, exceeding his touchdown expectation by +8.7 touchdowns. That’s the second-largest touchdown differential by any player over the past 12 seasons, ranking between DeAngelo Williams’ 2008 (+11.8) and Jordy Nelson’s (+8.2). Like in the cases of Williams and Nelson – who scored a combined 21 fewer touchdowns the following year – that’s a number that’s bound to regress. Keep in mind, if Henry was perfectly average in touchdown efficiency last season, he would have averaged 16.5 fantasy points per game (10th-most) instead of 20.0 (third-most).
The bottom line is, though Henry is no-doubt amazing, his workload is not. In PPR leagues, targets are worth 2.73x as much as a carry. Henry might lead the league in carries, but he’s never reached even 25 targets in a single season. That caps his upside, and also makes him extremely gamescript-dependent – it’s no coincidence he averages 20.4 FPG in victories across the past two seasons, but only 10.0 in losses.
Aaron Jones, RB, Green Bay Packers
XTD: 11.1, TD: 19, Diff: +7.9

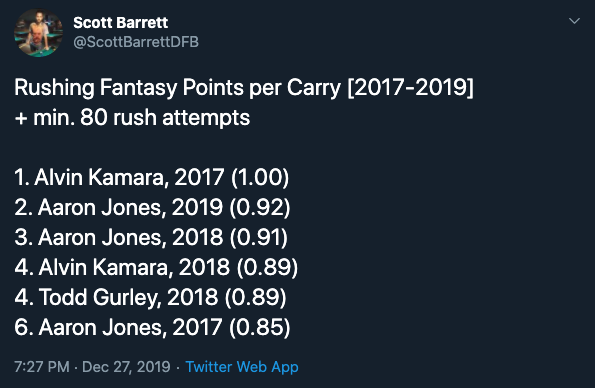
While Henry just put together one of the most-efficient / luckiest / flukiest touchdown efficiency seasons ever, Jones was right behind him. His differential of +7.9 ranked fourth-most over the past 12 seasons. Like with Henry, this is a number that’s bound to regress in 2020. And the regression will be big – Jones ranked fourth in FPG last season (19.7), but if he was perfectly average in touchdown luck, he would have finished ninth (17.0).
Beyond touchdown luck, Jones has been a top regression candidate for a few other reasons as well. Jones had a very favorable schedule last season (+0.90), but it projects to be far more difficult this year (-0.20). On top of that, and true to HC Matt LaFleur’s words, Green Bay’s two-way committee might now be a three-way committee after the team selected RB A.J. Dillon in Round 2. Keep in mind, Jones averaged 19.7 fantasy points per game last season, but that drops from 17.8 if we exclude games Jamaal Williams played one or fewer snaps.
Raheem Mostert, RB, San Francisco 49ers
XTD: 3.5, PPR: 10, Diff +6.5
Although we should expect far fewer touchdowns for Henry and Jones, we should also expect them to score touchdowns at a rate well above average. Why? Because they’re probably two of the five best pure runners in the NFL.
Mostert, an undrafted free agent who was cut by six NFL teams before joining the 49ers? Yeah, I’m not so sure he’s on the same level as Henry and Jones, though his touchdown differential might suggest he is. Of course, this also wouldn’t be the first time we’ve seen a Shanahan turn a relative nobody into a household name.
Mostert had just two career carries before Kyle Shanahan joined the team in 2017. Since then, Mostert averages an absurd 6.00 YPC on 178 career attempts. He averaged 5.64 YPC on 137 carries last season, which led the league and ranks 34th-best by any running back all-time. From Week 12 until the end of the regular season, Mostert ranked fourth in rushing fantasy points, but only 23rd in rushing attempts. He exceeded 20.0 fantasy points four times last season, but exceeded 12 touches only three times (and exceeded 16 touches only once). In the postseason, he scored 5.8, 48.6, and 13.0 fantasy points on 12, 31, and 13 touches. Or, as a percentage of the team’s total touches out of the backfield, 29%, 82%, and 57%.
Everything about Mostert, even beyond his 10 touchdowns despite just five opportunities inside the 10-yard-line screams outlier and regression to the mean. But at the same time, after a hyper-efficient 2019, the departure of Matt Breida, and a successful holdout threat (which earned him a nice little raise), it seems likely he’ll see an uptick of volume in 2020 (even if he is still stuck in a committee), which should help offset the looming regression.
A.J. Brown, WR, Tennessee Titans
XTD: 4.1, TD: 9, Diff: +4.9
Brown scored nine touchdowns last season, but Brown averaged 39.0 yards on touchdowns scored, with five of those touchdowns coming 45-plus yards out. For contrast, all of T.Y. Hilton’s five touchdowns came inside the red zone last year, for an average of 6.6 yards per touchdown scored. Those numbers are sure to regress for Brown. Brown’s +4.9 touchdowns scored over expectation (+0.30 per game) is sure to regress – that’s an unsustainable rate of scoring touchdowns relative to opportunity. What might not regress is Brown’s fantasy point per game average.
Why? Because Brown really might be one of the next superstars at the wide receiver position.
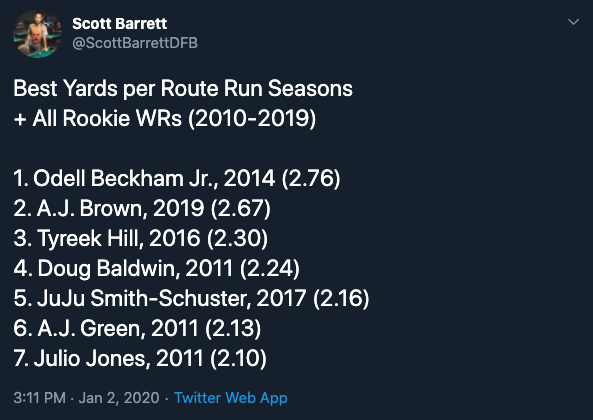
Last season (per PFF), among all 79 wide receivers to see 50 or more targets, Brown ranked third in yards per route run (2.67), second in passer rating when targeted (127.6), second in missed tackles forced per reception (0.31), first in yards per target (12.5), first in yards after the catch per reception (8.88), and first in yards after contact per reception (5.02).
He won’t be as lucky in the touchdown department next season, but I’d bet an increase in target volume helps make up for it.
Leonard Fournette, RB, Jacksonville Jaguars
XTD: 9.6, TD: 3, Diff: -6.6
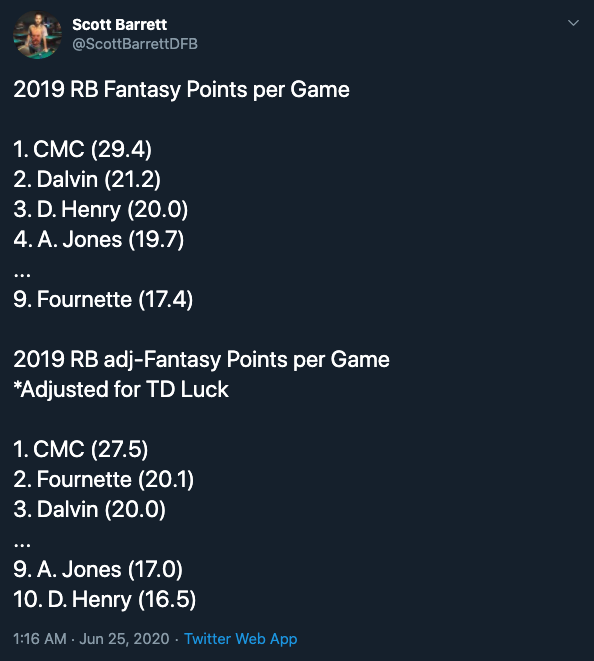
In an offseason where I called Lamar Jackson, Chris Godwin, Mark Andrews, and Dalvin Cook breaking out, my Fournette call was right there with them. We just got really really unlucky.
Fournette scored just three touchdowns in 2019, though, if he were perfectly average in touchdown efficiency, he would have scored 9.6. Essentially, that was the difference between him finishing ninth (17.4) and second (20.1) in FPG.
Last season, Fournette ranked second in Snap% (88.5%), second in snaps per game (60.1), second in weighted opportunity points per game (21.2), and fourth in red zone opportunities per game (3.5). Keep in mind, (for running backs) snaps per game and weighted opportunity points per game are two of the best, stickiest, and most-predictive stats in fantasy football. It’s a total statistical anomaly he didn’t finish as a top-three fantasy running back in 2019.
Fournette fell 6.6 touchdowns short of his volume-based expectation, which ranks third-worst all time. Just behind Matt Forte’s 2009 season (-7.9) and Julio Jones’ 2017 season (-7.0). Although they each scored five more touchdowns in their following season, and Fournette surely will exceed three touchdowns next year, it’s hard to be too bullish about his 2020 fantasy projection. Losing OC John DeFilippo (who prefers a bell-cow running back and loves to pepper them with targets in the passing game) for OC Jay Gruden (who prefers a committee backfield) absolutely crushes his fantasy expectation.
Mike Williams, WR, Los Angeles Chargers
XTD: 7.1, TD: 2, Diff: -5.1
The touchdown regression hit Williams HARD in 2019. He came into this season as one of our top touchdown regression candidates, exceeding his volume-based expectation by +4.6 touchdowns in 2018. Now, after falling 5.1 touchdowns shy of his expectation, he’s one of our top positive regression candidates.
If not for the quarterback downgrade, Williams would be a glaring value, ranking 47th in ADP after finishing as one of just 25 1,000-yard wide receivers last year.
Nick Chubb, RB, Cleveland Browns
XTD: 11.4, TD: 8, Diff: -3.4
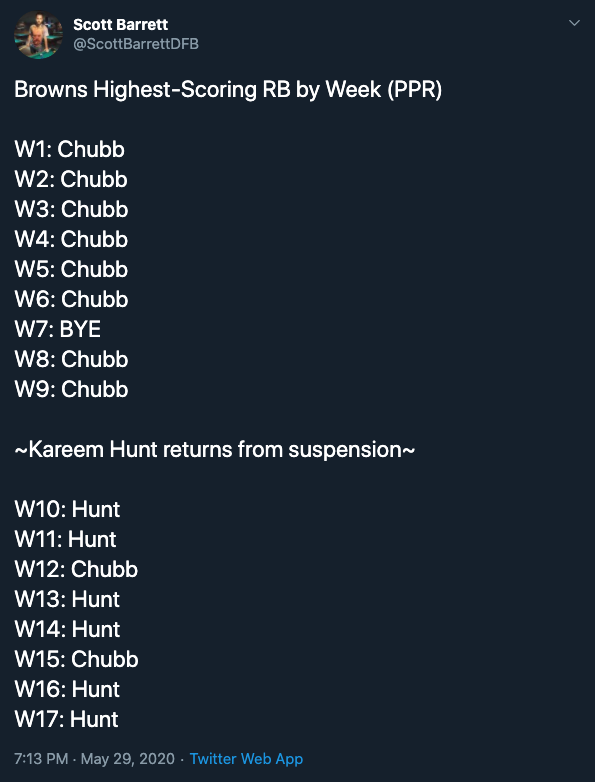
At least on paper, Chubb looks like a top positive regression candidate. If he were perfectly average in touchdown luck last year, he would have scored an additional 1.3 fantasy points per game. The bigger concern for Chubb, however, is Kareem Hunt.
Chubb averaged 18.9 fantasy points per game through the first nine weeks of the season. Then Kareem Hunt returned from suspension. And, from that point on (Week 10-17), Chubb averaged just 13.0 fantasy points per game. Actually, Hunt outscored Chubb in six of those eight games.
Chubb finished the season sixth in expected touchdowns per game (0.72). But what’s interesting is Hunt didn’t put a dent in Chubb’s near-end zone usage. Hunt saw only two opportunities inside the 10-yard-line all season, while Chubb averaged 1.6 such opportunities per game before Hunt’s return and 2.0 per game after his return.
Hunt will continue to siphon targets away from Chubb, which means, like Henry, he’s a gamescript-dependent workhorse, rather than a true bell-cow. But, at least, Chubb’s role as the team’s goal-line back should remain safe.
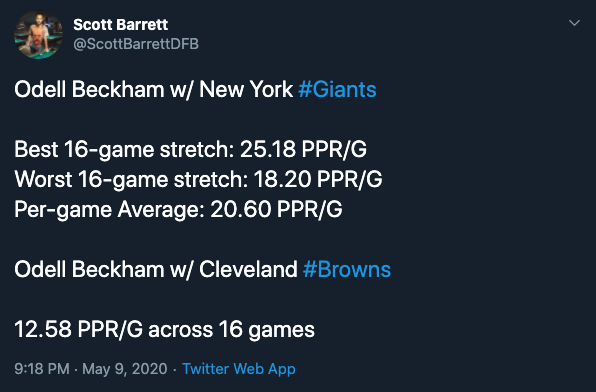
Odell Beckham, WR, Cleveland Browns
XTD: 7.3, TD: 4, Diff: -3.3
In a season where it seemed everything that could go wrong did go wrong, add “poor touchdown luck” to the list. In addition to that, Beckham Jr. played the entire season with a sports hernia, while also having the league’s toughest cornerback schedule.
If Beckham’s 2019 season really was just a fluke, his ADP should be two rounds higher.