
Introduction
Earlier this week, I released an article titled “Upside Wins Championships” which introduced a draft-strategy (or, really, more of a draft-‘ethos’) describing essentially that: when it comes to winning fantasy championships, UPSIDE IS EVERYTHING. A player’s bull-case projection matters much more than his base-case projection which matters far more than his bear-case projection. Leagues are won and lost not by balanced teams drafting a number of good-to-great ADP-beaters, but by teams who correctly identified a few key league-winners and rode those players all the way to a Championship title.
In other words, our goal when drafting should be trying to identify players with league-winning upside. It’s not easy, but as I showed here, it’s probably a lot easier than you might think. In that article (released in 2020), we took a look at the top-10 league-winning players over the prior three seasons, and after re-examining my pre-season analysis on each player, it was clear that far more often than not I did correctly identify the league-winning upside in each player.
In today’s article, we’re going to be doing something similar but from a different angle. We’ll be working backwards now, looking at the top league-winners over the past four seasons, but instead of viewing each player through the lens of an ex-ante analysis, we’ll be applying an ex-post analysis on each position. Essentially, we’re trying to find a common thread that links some or all of these players together. And in so doing, hopefully, identify potential league-winners in 2021 and beyond.
Methodology
How are we defining league-winners? Rather than merely highlighting ADP-beaters – which as we showed in ‘Upside Wins Championships’ is exactly the wrong way to think of league-winners – we’re defining league-winners by their rate of occurrence on ESPN Playoff teams.
A few things:
1) This means every observation and relevant takeaway must be understood within the context of ESPN’s unique settings. An ESPN standard league is as follows:
10 teams
PPR scoring, 4 points per passing touchdown
Starting 1QB, 2RB, 2WR, 1TE, 1Flex, 1K, 1DEF
7bench spots
In other words, this is the worst type of league to employ a Zero-RB strategy. Running backs are by far the most valuable position in ESPN standard leagues, and there’s not even really a close second. As for the reason, it has to do with positional scarcity, and was explained beautifully and succinctly by Adam Harstad here.
Imagine the same type of league, but with an added Superflex spot. Quarterbacks would become roughly 2X as valuable, and now at least nearly as valuable as running backs. Or, imagine if instead of adding a Superflex spot, the league added another starting wide receiver spot. Wide receivers would become roughly 1.4X more valuable. This is also one of the better types of leagues to chase upside. The quality of the available players on your waiver wire is going to be significantly better here (10 teams, 9 starters, 7 bench spots) than in an FFPC high-stakes league (12 teams, 10 starters, 10 bench spots).
2) Why did we choose “rate of occurrence on ESPN Playoff teams” rather than “rate of occurrence on ESPN Championship-winning teams?” Forgive me for going deep into the weeds once again (and we’ll dig deeper into this at the end of the article), but fantasy playoff performance is mostly a function of variance while fantasy regular season performance is far more a function of skill.
Who is the best team in the NFL in any given season? Probably the team with the best record across the largest sample, and not necessarily the team that ultimately won the Super Bowl. Though the team with the best odds of winning the Super Bowl is probably the team with the best regular season record, that doesn’t frequently happen (think 2007 Giants/Patriots or 2017 Eagles/Patriots). Essentially, being the best team across 16 games is far more representative of skill than being the only undefeated team through three or four consecutive games. This is true in all games of skill and chance – the smaller the sample, the more variance (the more luck and less skill) at play.
The same thing is true with fantasy football. It’s easier to be the best team from Weeks 15-17 than it is to be the best team from Weeks 1-14. And the same thing is true with fantasy football players. Who is most likely to dominate from Weeks 15-17? Probably the players who dominated from Weeks 1-14, though that’s not always the case.
3) A four-year sample size is infinitesimally small. I have nothing else to say for myself other than that it was the largest sample I have access to. Nonetheless, mea culpa.
Ex-Post Analysis
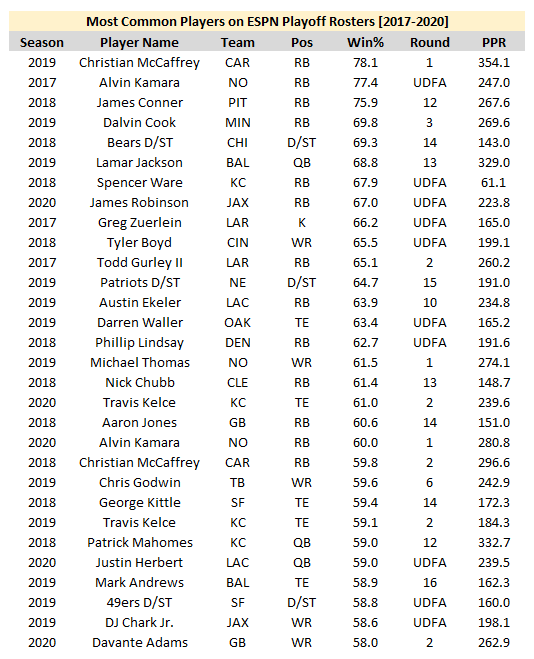
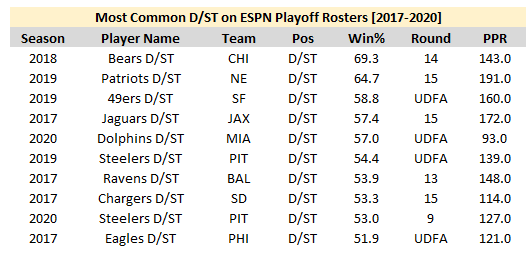
NOTE: In the above chart, as outlined in the Methodology breakdown, “Win%” should be read as the percentage of teams making the fantasy playoffs with the particular player on the roster.
Quarterbacks
Positional Analysis
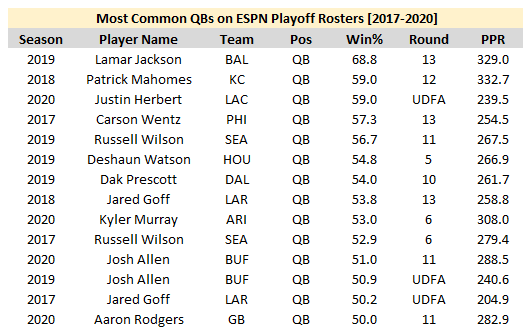
At the quarterback position, I saw two immediate takeaways:
1) Clearly, you don’t need to draft a quarterback high. In fact, it’s probably a mistake to do so.
10 of our 14 quarterbacks were drafted in the last five rounds of the draft or not at all.
2) Even if you do hit on a late round gem, it’s still not really much of an advantage.
Typically, the top QB provides about as much value as the top defense.
Again, I think this goes back to our earlier point on scarcity. Quarterbacks outscore all other positions, but they’re the least-scarce (essentially tied with defenses and kickers) and thus the least-valuable position in this format.
In 2018, Patrick Mahomes scored the most fantasy points by any quarterback in any season in NFL history. In 2019, Lamar Jackson averaged the most fantasy points per game of any quarterback in any season in NFL history. Both players accomplished these feats with an ADP in the double-digit rounds. And even so, both ranked quite low overall (in terms of helping you advance into the playoffs). In fact, Mahomes ranked only 10th-overall in Win% (a.k.a. percentage of ESPN playoff teams rostering this player) in 2018.
Lesson Learned: As ridiculously good as Mahomes and the Konami Code QBs certainly are, you’re still better off leaning towards under-paying rather than overpaying for a quarterback in fantasy.
Player Analysis
Interestingly, 6 of these 14 league-winning quarterbacks (including three of the top-four) were entering their sophomore season. Other examples, within a broader sample, might include Andrew Luck in 2013 (QB9 ADP vs. QB4 finish) and Blake Bortles in 2015 (QB26 ADP vs. QB4 finish). Perhaps current drafters are sleeping on one or more of Justin Herbert (ADP: QB7), Jalen Hurts (QB10), Joe Burrow (QB13), Tua Tagovailoa (QB19), or Jordan Love (QB36)? In fact, that’s exactly what Jake Tribbey argued in Sophomore Standouts.
Seven of our top-12 quarterbacks averaged at least 3.0 rushing fantasy points per game. This is no coincidence. Mobile quarterbacks are basically a cheat code in fantasy football. Clearly, when 50 rushing yards and one rushing touchdown is equivalent to 175 passing yards and one passing touchdown, Lamar Jackson has a massive advantage over a pure-passer like Tom Brady.
In several instances, we might have been underrating the impact of a new offensive play-caller joining the team. This was at least certainly the case with Lamar Jackson (2019), Dak Prescott (2019), and Jared Goff (2018), though several others might qualify. (As I detailed in my pre-draft analysis, Jackson and Prescott were my two highest-owned quarterbacks in 2019 for this reason, among others.) Perhaps this year, we’re sleeping on Matthew Stafford (HC Sean McVay), Sam Darnold (OC Joe Brady), Matt Ryan (HC Arthur Smith), or Russell Wilson (OC Shane Waldron) who all seem to have upgraded from their 2020 playcaller. We’ll go more in-depth on play-caller analysis later in the season.
In the case of Patrick Mahomes, we also may have been underrating his coaching staff and supporting cast, especially after Alex Smith easily hit career highs and led the league in passer rating and AY/A, and then was unceremoniously traded away for the sophomore. All of this reminds me quite a bit of rookie Trey Lance. You can read my full argument for him here.
Might we be sleeping on Jared Goff? Goff has already twice proven to be a league-winner when overlooked by fantasy drafters, and in 2021 is apparently being overlooked again (ADP: QB28). From 2017-2018 the Rams went 24-7 and Goff ranked behind only Patrick Mahomes and Drew Brees in ANY/A (7.70). He doesn’t have much to throw to in Detroit, but he will have to throw a lot for a Lions team projected to finish bottom-3 in Win%. So are we sleeping on Goff? I’d say probably not, and the better argument is for Matthew Stafford (ADP: QB11). Just two years ago his current head coach – Sean McVay – was still being heralded as the greatest offensive mind in football. Stafford has long been a Greg Cosell favorite, and, paired up with McVay, Cosell thinks he has a great chance of winning MVP if he can stay healthy (current odds put him at +1600, tied for 5th).
Running Backs
Positional Analysis
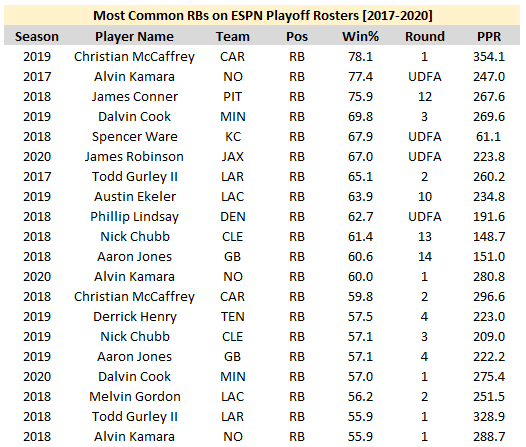
Like it or not, the running back position is THE most-important position in fantasy.
More so than any other position, running backs make up the far majority of any season’s league-winners. And, typically, you’re going to have to pay up to acquire them.
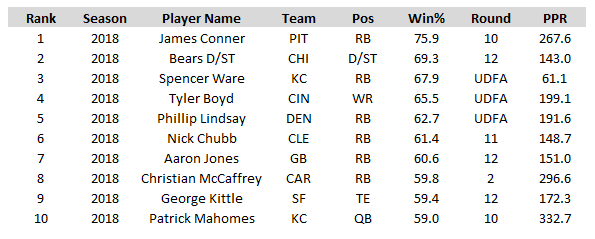
Excluding Spencer Ware – a late-season pick-up who only started two games – 58% of the running backs on our chart were drafted in the first two rounds. 63% were drafted in the first four rounds.
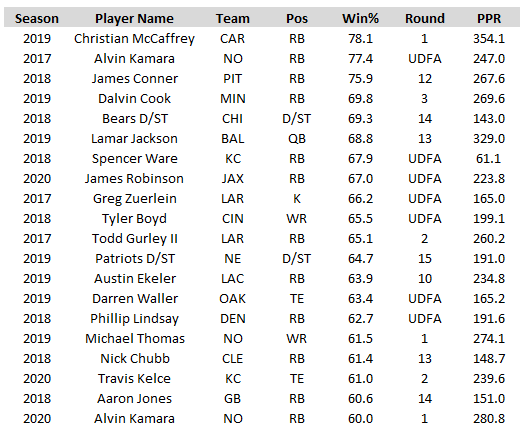
Over the past four seasons, 12 running backs scored a Win% of at least 60.0%. Over the same span, only two wide receivers, one quarterback, two tight ends, two defenses, and one kicker reached that threshold. (See below chart.)
Why is this so? Well, because of scarcity – as we keep saying. But also, because running backs are typically your high-end producers. Over the past four seasons, nine of the top-10 highest-scoring flex-eligible players (by fantasy points per game) were running backs.
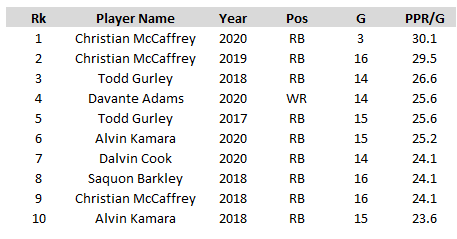
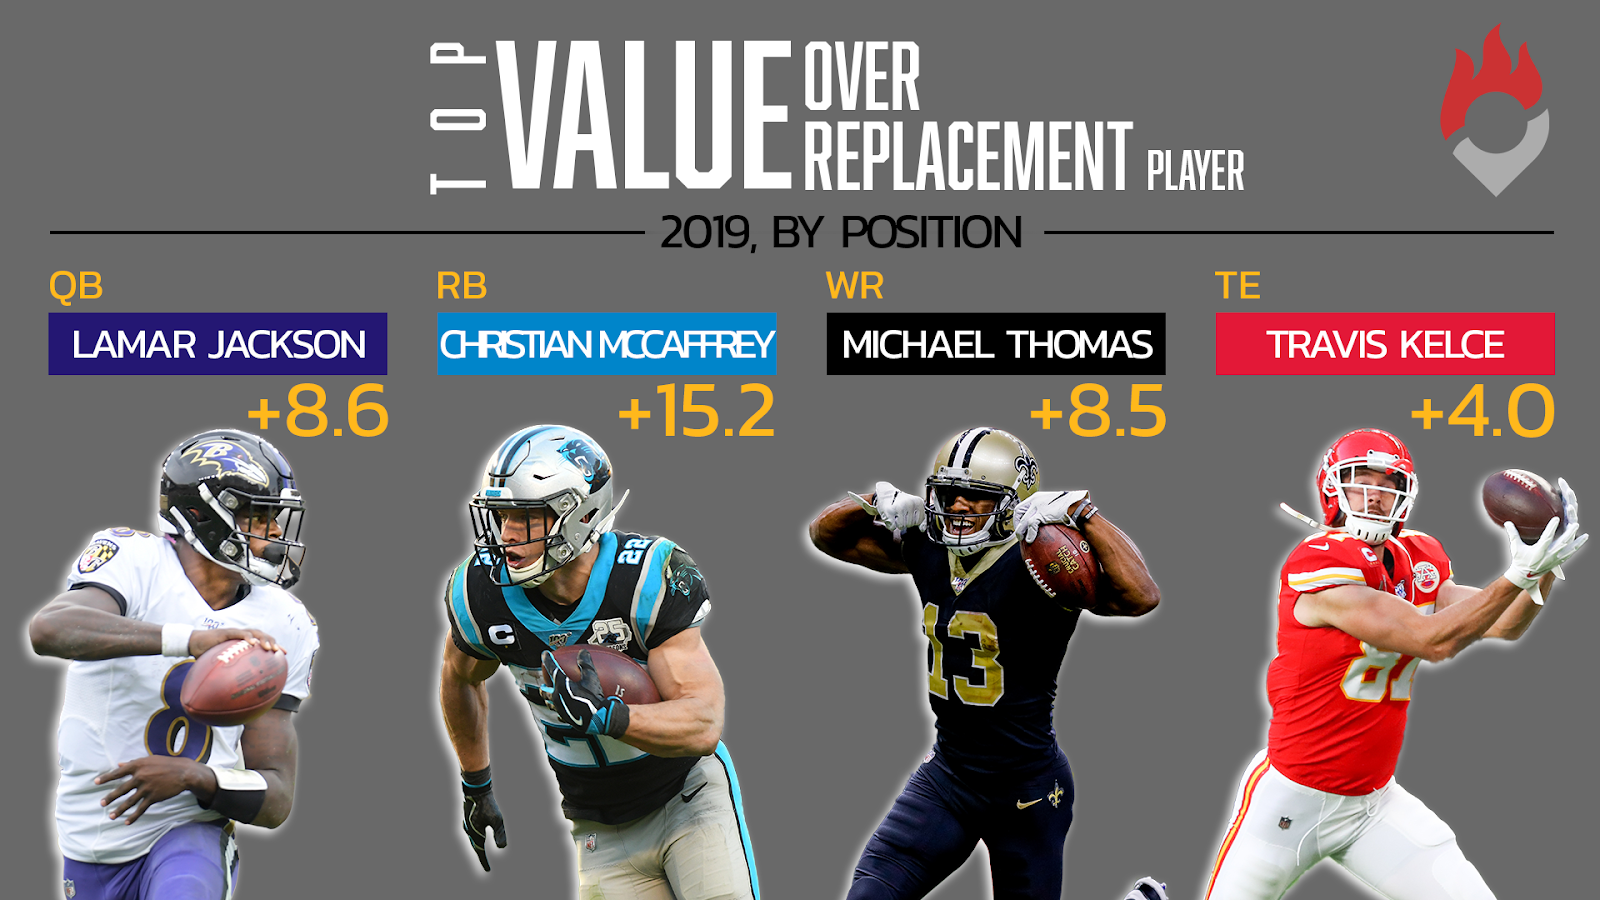
Balancing both points: despite being drafted with a top-three pick in nearly every draft in 2019, it felt almost impossible to own Christian McCaffrey and not make your league’s playoffs. This was due in part because he out-scored the next-closest wide receiver by +6.0 fantasy points per game, but also because he out-scored the worst starter-worthy running back (RB20) by +15.2 fantasy points per game. In contrast, Lamar Jackson outscored the worst starter-worthy quarterback (QB10) by +8.6 fantasy points per game. Michael Thomas outscored the worst starter-worthy wide receiver (WR20) by +8.5 fantasy points per game, and even further behind was Travis Kelce (+4.0).
This discrepancy becomes even more glaring when contrasting to the best-available running back or wide receiver on your waiver wire.
So, should you go out of your way to draft at least two running backs in the first three rounds? Is ‘Zero-RB’ a suboptimal draft strategy? Yeah, probably.
Again, this is specific to ESPN standard leagues and to our data — which only goes back four seasons — but all of these assumptions have certainly held true over that timeframe. Leagues are won and lost at the running back position and league-winning running backs are typically only found early in your draft.
Broadly speaking, this has been true and I think this will probably be true again in 2021. But of course, it’s not infallibly true, or true in a vacuum. That’s because every season is unique in its own way and value is always relative to the cost to acquire.
Player Analysis

Excluding Spencer Ware (who will also be excluded for the remainder of this article), all 10 of the top-10 running backs on this chart were entering their first, second, or third year in the NFL. Additionally, all 19 running backs to make this chart were 25 years old or younger, and 15 of the 19 were 24 years old or younger. This isn’t a coincidence. Statistically-speaking, running backs are far more productive early in their careers than any other position. Rookie running backs dramatically outperform rookie wide receivers and tight ends. Running backs hit their peak years much more quickly (Years 2 and 3) and also start to decline much sooner than any other position. Unfortunately, it seems ADP has already caught up to this trend, with Jonathan Taylor, Cam Akers (pre-injury, of course), Najee Harris, Antonio Gibson, D’Andre Swift, J.K. Dobbins, Clyde Edwards-Helaire, and Travis Etienne all being drafted in the first four rounds. But don’t be surprised if a few other Year 1-3 running backs surprise with a league-winning season.
Of the non-rookies, we also see a number of running backs making the list following a play-caller change: 2017 Todd Gurley, 2018 Christian McCaffrey, 2019 Dalvin Cook, 2019 Derrick Henry, and 2019 Leonard Fournette. In many cases, I don’t think this is a coincidence. In 2017 Sean McVay promised reporters Gurley would be an every-down bell-cow heavily used in the passing game, and besides, it’s hard for any coach not to be a massive improvement on Jeff Fisher. Similarly, Dion Lewis out-snapped Derrick Henry in 12 of 16 games in 2018 (under Matt LaFleur). It was hard to imagine Arthur Smith wouldn’t remedy that to some degree. For McCaffrey and Cook, the running back resumes of Gary Kubiak and Norv Turner speak for themselves. John DeFilippo also promised a lot more passing work and a true bell-cow workload for Fournette in 2019, which eventually proved true. This brings us to our next point…
Perhaps we should pay more attention to what coaches are saying to us, rather than just immediately dismissing it as “coach-speak”. In addition to Todd Gurley (2017) and Leonard Fournette (2019), there are a number of instances where a breakout might have been more obvious had we only listened to a player’s coach and/or front office. Savvy drafters could have envisioned 16.5 fantasy points per game or more for a rookie-year Alvin Kamara based on the role GM Mickey Loomis was envisioning for him. In 2018, both Ron Rivera and Norv Turner (in separate interviews) said 25-30 touches was a realistic expectation for McCaffrey. Last season, HC Doug Marrone told us James Robinson could play all three downs, and then later, that his stellar training camp played a role in the team’s decision to release Leonard Fournette. I’m sure there are other examples we can pull as well.
The running back position is also the most volume-dependent position in fantasy. Therefore it’s no surprise that 14 of the running backs on our list ranked top-12 in weighted opportunity per game. Compare that to 15 running backs ranking top-12 in fantasy points per game. The outliers were 2019 Derrick Henry (just missed the cutoff), 2018 Phillip Lindsay, 2018 Aaron Jones, and 2018 Nick Chubb. So, basically, Lindsay and three of the league’s five best and most-efficient runners on the ground. For running backs, volume is far more important, sticky, and predictive than efficiency when it comes to scoring fantasy points, but that also doesn’t mean hyper-efficient running backs can’t surprise us every now and then. They’re just difficult to see coming – essentially variance-driven outliers – and typically not good bets ex-ante.
On that point, some of these breakouts might have been borderline impossible to have seen coming in the preseason. Even back when he was going undrafted, James Conner was my No. 1 must-draft handcuff and a top sleeper, but even I never would have imagined Le’Veon Bell would sit out the entire season. Nick Chubb was always a bet on talent over opportunity, but surely you didn’t envision Carlos Hyde getting traded halfway through his rookie season. Nor could anyone foresee the Jaguars just straight up cutting Leonard Fournette following a 1,674-YFS season and then handing UDFA rookie James Robinson the identical role.
There are only 28 instances of a running back averaging at least 5.5 targets per game over the past three seasons (seven per season), but 9 of our 19 running backs averaged at least 5.5 targets per game. That’s no coincidence – for running backs, targets are worth 2.64X as much as a carry in PPR leagues. This seemed about as important of a factor as gamescript, for instance, as only 10 of our 19 running backs (53%) were on teams that finished above .500.
Wide Receivers
Positional Analysis
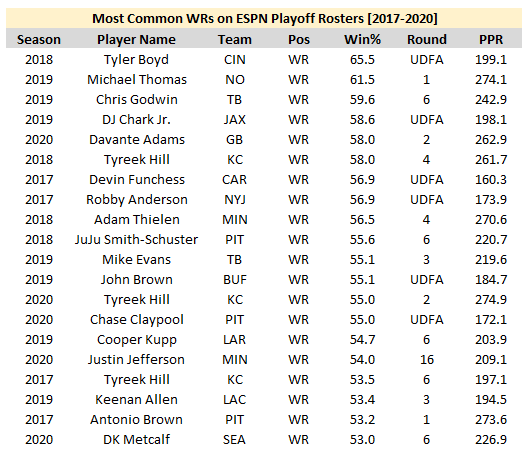
Looking back at our running back chart, you’ll see 47% of our sample was drafted in the first two rounds. But in this chart, you’ll find only 4 of 20 wide receivers (20%) were drafted in the first two rounds. Why? Because, again, the running back position is the most important position in fantasy. High-end running back production simply matters more than high-end wide receiver production, and if you’re drafting a wide receiver early, you’re not drafting a running back early (which is where league-winning running backs tend to reside).

In addition to fewer early-round names, you also see a large number of UDFAs. And you barely see any (actually only one) wide receiver selected in Rounds 7-16. Why is that? Well, because wide receiver is definitely the second-most important position in ESPN leagues and because ADP is actually pretty accurate with wide receivers and especially high-end wide receivers (in comparison to the other positions). But also (I suppose because it’s the deepest position) don’t be surprised to find a gem off waivers early in the year. And the fact that you can — more often than any other position — helps drag the value of the position down overall.
Player Analysis

Unlike with running backs, 9 of our 20 qualifiers (45%) were age 25 or older. That makes some sense, as wide receivers do tend to break out later in their careers than running backs. Generally, a wide receiver’s breakout year and, actually, peak year is Year 3. Perhaps uncoincidentally, 4 of the top-7 wide receivers on our chart were entering their third year in the league. Could third-year wideouts A.J. Brown, D.K. Metcalf, Terry McLaurin, or Diontae Johnson be one of the top league-winners of the 2021 season? Or, might Marquise Brown, Deebo Samuel, Parris Campbell, Jakobi Meyers, or Mecole Hardman at least exceed expectations? I’d say the odds are very good.
While Year 3 is a wide receiver’s breakout year, their best two-season stretch is Years 5 and 6. (In contrast, remember, a running back’s best seasons come in Years 2 and 3.) This again showed up in our data, with 10 of our top-15 league-winning wide receivers being somewhere between Year 3 and Year 6 in their careers. There could be some sort of lesson there, and an edge to us – don’t give up on wide receivers too early. Tyler Boyd broke out in Year 3 (7.8 to 5.7 to 15.8 fantasy points per game) with second-round draft capital. DeVante Parker broke out in Year 5 (6.7 to 10.3 to 10.0 to 5.5 to 15.4 fantasy points per game) with Round 1 draft capital. Former top-five-pick Corey Davis didn’t break out until Year 4 (6.3 to 11.5 to 7.7 to 13.7). Are we unfairly sleeping on players like Mike Williams, Henry Ruggs, Breshad Perriman, N’Keal Harry, John Ross and others who have disappointed despite good draft capital? Maybe.
14 of our 20 wide receivers (70%) finished the season top-12 in fantasy points per game, though, only nine wide receivers (45%) finished top-12 by targets per game. And seven finished outside of the top-20. Wide receivers, like running backs and tight ends, are heavily reliant on volume for fantasy points, but far less so than for running backs. On this point, Washington’s signing of Curtis Samuel could actually be beneficial for Terry McLaurin. His number of routes run would remain unchanged, and while he may see fewer targets (though I’m not even sure that’s correct), his efficiency should increase. Washington will likely be able to run more plays, more plays near the end zone, and he’ll face fewer double-teams (technically, bracket coverage) from opposing defenses.
While efficiency outliers (a.k.a. regression candidates) should be avoided at the running back position, that’s not entirely true for wide receivers. The efficiency numbers aren’t repeatable, but high-efficiency seasons do tend to lend themselves towards more volume in the following year, as I proved here. We also saw this play out in our data. 7 of our 12 (58%) wide receivers (eight didn’t qualify) ranked top-15 in fantasy points per target in their previous season. In the actual season, only 6 of 20 (30%) ranked top-15. What’s the takeaway here? Volume is more important than efficiency in fantasy, but efficiency can also do a pretty good job of predicting a future increase in volume. Might Will Fuller (first in fantasy points per target), Rashard Higgins (second), Justin Jefferson (fourth), or Nelson Agholor (sixth) be in line for more volume and a breakout season this year?
Nine of our 20 qualifiers (45%) were slot, rather than outside, wide receivers. Over the same span, only 31% of any season’s fantasy WR1s were slot wide receivers. It’s not obvious to me why, but perhaps fantasy drafters do tend to underrate slot wide receivers by ADP. Perhaps because they’re so much less important than outside wide receivers in real life.
Tight Ends
Positional Analysis
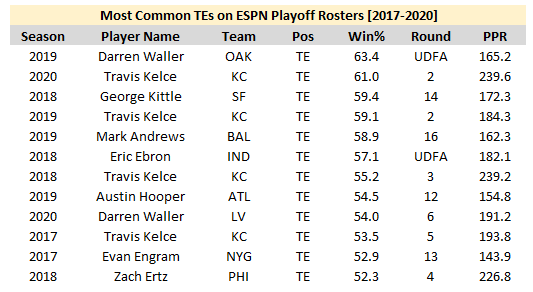
What immediately jumped out to me here was how obvious this list looks both pre- and post-hindsight. All 12 tight ends finished top-six in fantasy points per game, and 10 of 12 finished top-4. Basically, all of the names on this list are all of the names you’d expect to see.
Even pre-hindsight these players were pretty obvious. Mark Andrews was my top tight end sleeper in 2019 and Darren Waller ranked right behind him. In 2018, George Kittle was Graham Barfield’s top sleeper, and Eric Ebron was John Hansen’s top sleeper. Add in Travis Kelce, who made the list all four years and that’s already two-thirds of the list.
Beyond that, ADP was all over the place: 50% of our list was selected in the last four rounds of the draft or not at all, while the other 50% had an ADP in the first six rounds. Last year, the two most-valuable tight ends were Travis Kelce and Darren Waller, but UDFAs Logan Thomas and Robert Tonyan were third and fourth. And I think this all points to the optimal approach when drafting tight ends; go big or go home — target a premium tight end in the early rounds or wait at the position. Earlier this offseason (here) I talked about the death of the middle class at the tight end position, and how the few ‘Oligarch Tight Ends’ are a borderline cheat code for fantasy (like Konami Code Quarterbacks, except even more valuable).
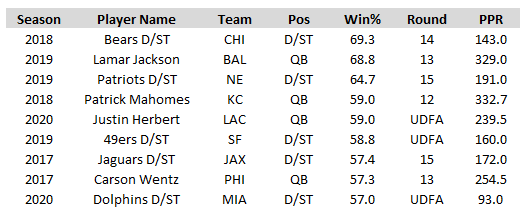
Although all of these tight ends finished top-six in fantasy points per game, you don’t necessarily need an elite tight end to win your league. Tight end is the third-most valuable position in fantasy, but on the whole, is still probably closer to quarterback and defense in terms of value (than running backs and wide receivers). Over the past three seasons, there are 50 instances of a player finishing with a Win% of 55.5% or higher. Here’s how that composition shook up:
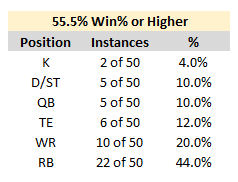
One might argue, based on these numbers, that high-end running backs are worth roughly 2.2X as much as high-end wide receivers, which are worth roughly 1.7X as much as high-end tight ends, which are worth roughly 1.2X as much as high-end quarterbacks (which are worth the same as high-end defenses). Or, rather, high-end running backs are worth roughly 2.2X as much as high-end wide receivers, 3.7X as much as high-end tight ends, and 4.4X as much as high-end quarterbacks and defenses.
At the very least, this has literally been true of league-winners (defined as narrowly as we have, but which can be used somewhat interchangeably with “high-end producer relative to price”) over the past four seasons. And the values here do seem to follow what we’d naturally expect based on Harstad’s back-of-the-napkin math on positional scarcity.
Player Analysis

Without question, Travis Kelce has been one of the most underrated players in fantasy for a number of years now. In fact, he’s the only player with a Win% over 50% in each of the past four seasons. He posted a 61.0% Win% last year, which ranks second-best among tight ends in our sample, and that’s despite the handicap of an ADP in the early- to mid-second round. Over the past five seasons, Kelce has finished first, first, first, first, and first among tight ends in fantasy points. Among all wide receivers, he would have ranked top-10 in fantasy points in each of the last four seasons. Last year he averaged the most FPG by any TE in any season all-time (20.9), and, among wide receivers, would have ranked behind only Davante Adams and Tyreek Hill. By VORP (Value Over Replacement Player), it was even more obvious he’s long been worthy of a first-round pick in 12-team leagues, finishing (among all players) second, sixth, 11th, and 12th. Or, versus wide receivers first, third, third, and third.
In 2019, Waller was another instance of us underrating coach-speak. Coach Jon Gruden said all offseason, Waller was one of the NFL’s “best-kept secrets” and would be given “the chance of a lifetime” as Oakland’s TE1. Just the year prior, in Oakland, Jared Cook finished top-five in total fantasy points. We already brought this point up with running backs, though Patrick Mahomes (2018) and Chris Godwin (2019) also qualify, among others.
Two sophomore tight ends made this list, and, like with quarterbacks, I don’t think that’s too surprising. Tight ends typically make a massive leap from their rookie to sophomore seasons. And it probably shouldn’t be too surprising who these two sophomore tight ends (specifically) were: George Kittle and Mark Andrews. Evan Engram was one of the all-time great outliers, but typically, rookie tight ends rarely finish as fantasy-relevant contributors. Although as rookies Kittle and Andrews weren’t dependable options for fantasy, both did post historically great rookie seasons, finishing with 500-plus receiving yards – something only 16 other tight ends have accomplished over the past 30 seasons. Although not quite on the level of Andrews or Kittle, keep an eye on sophomores Adam Trautman (ADP: TE19) and Donald Parham (TE38) heading into 2021.
Defenses
If just looking at Win% you might think that top defenses are worth just as much as the top quarterbacks. And, well, that’s technically true, but only technically. We need to be thinking about positional value as a sort of three-legged stool. (Or, at least that’s what Adam Harstad told me here.) One leg of the stool is ‘scarcity.’ Another is ‘replaceability,’ or how valuable a player is over his peers (think VORP). The third leg is ‘predictability.’ The stool (value) needs all three legs to stand.
Team defenses are just as scarce as quarterbacks and rank similarly in in-position scoring differential, but they are far less predictable. Since 2015, the odds of a defense being drafted in the top-5 (by ADP) and actually finishing in the top-5 (by FPG) is only 17%. Contrast that to tight ends at 50% and wide receivers at 53%. But while defenses are massively unpredictable if projecting full season production in the offseason, team defense scoring is very predictable in-season in any given week. I talk about all this in further detail here.
And because team defense is low-scarcity and highly predictable week-to-week, your “replacement player” should actually be a lot higher than D/ST13. By streaming defenses week-to-week, you should easily be able to cobble together high-end production with a floor of about D/ST6, as I showed here. And, realistically, that’s the route you should go (streaming the position), as opposed to wasting valuable draft capital at the position.
In my own leagues, I’m typically not even drafting a defense, unless I’m drafting very close to the start of the season. Instead, I’ll draft high-upside players in the last round like a Darrel Williams, Devontae Booker, or Samaje Perine. If Clyde Edwards-Helaire, Saquon Barkley, or Joe Mixon were to suffer an injury in the preseason, either one of these late-round players could be a weekly RB2 or better — a much greater advantage than owning a top team defense. If that happens, I’ll drop a different player and add a defense right before Week 1.
Overall/Playoff Rosters vs. Championship Rosters
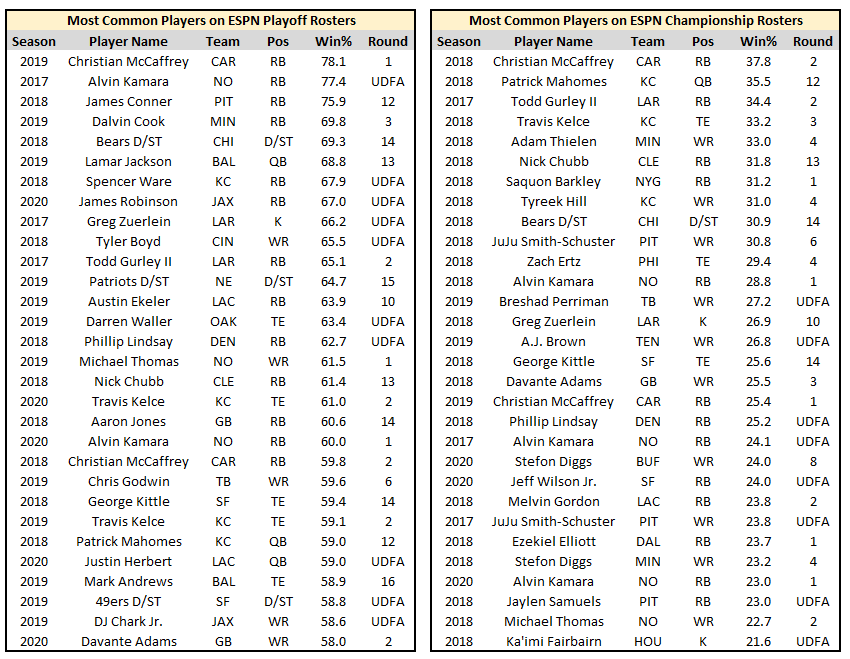
What do these two charts tell us about positional value? Among the top-30 most common players on playoff rosters, we see 3 quarterbacks, 13 running backs, 5 wide receivers, 5 tight ends, 3 defenses, and 1 kicker. Among the top-30 most common players on championship rosters, we see 1 quarterback, 13 running backs, 10 wide receivers, 3 tight ends, 1 defense, and 2 kickers. Again, running backs are typically your league winners, followed by wide receivers. And contrary to the Zero-RB theory, league-winning running backs are not easily acquired.
How much overlap was there between these two charts? Very little. Only 10 of 30 players (30%) appeared on both charts. As for why this is, this goes back to the point made in our introduction. Fantasy postseason performance is far more a function of volatility than fantasy performance in the regular season, which is far more a function of skill. As for a fantasy-relevant takeaway, it’d be easy for me to say “Don’t be afraid to ‘stream’ your way to a title.” Look at what James Robinson (UDFA), Logan Thomas (UDFA), Justin Herbert (UDFA), Myles Gaskin (UDFA), Mike Davis (UDFA), and Robert Tonyan (UDFA) accomplished last year, but, at the same time, that’s a lot easier for me to say now in hindsight.
Across both charts, only 4 of our 60 (7%) league-winners were drafted in Rounds 5-9. Why is the middle-bulk of the draft so under-represented by our data? Well, basically, it’s harder to be a league-winner with a low ADP (expensive pricetag). The players who were able to rise above it, were truly dominant, sometimes posting historically great numbers. And the players capable of posting such dominant numbers are typically known names who were already being drafted early. That’s my theory anyway.


