
As we’ve detailed before, volume is just about all that matters for running backs in fantasy football. Unfortunately, all of the immediately available stats within an RB’s gamelog are wholly inadequate for gauging volume, at least through an appropriate fantasy lens.
Targets, carries, and especially red zone opportunities lead to very different amounts of fantasy points. And “raw touches” are worse than useless. This article offers a solution in the form of a single number: weighted opportunity, a volume metric for RBs designed to give proper weighting of the value of every touch in a way all other stats fail to.
First created by Scott Barrett in 2019, weighted opportunity is one of the most stable and predictive stats we have for RBs. It’s also most closely related to what we care about — actual fantasy points.
The biggest edge in fantasy football is knowing which stats matter and which are noise.
— Ryan Heath (@RyanJ_Heath) May 7, 2024
For RBs, volume is almost EVERYTHING. But I don't mean snaps, carries, or touches.
Every carry and target in and out of the Red Zone holds different value.
Weighted Opportunity rules all. pic.twitter.com/1zZml1sF20
To demystify what exactly weighted opportunity is, I’ll briefly walk through the process of calculating the stat. Along the way, you’ll find an unplanned but incredibly important detour, where I investigate whether “regression” actually matters in fantasy football and whether it’s smart to target previously inefficient players. And then, as per usual, the jaw-dropping stats and specific player takes stemming from this important metric are down at the bottom.
Calculating Weighted Opportunity
Don’t worry, we do all of this work for you within minutes of the games ending every week. Weighted opportunity can be found in the free Basic Rushing table of the Fantasy Points Data Suite. Make your free account today!
Weighted opportunity is first and foremost derived from history: how many fantasy points do RBs usually score when they receive a carry or a target?
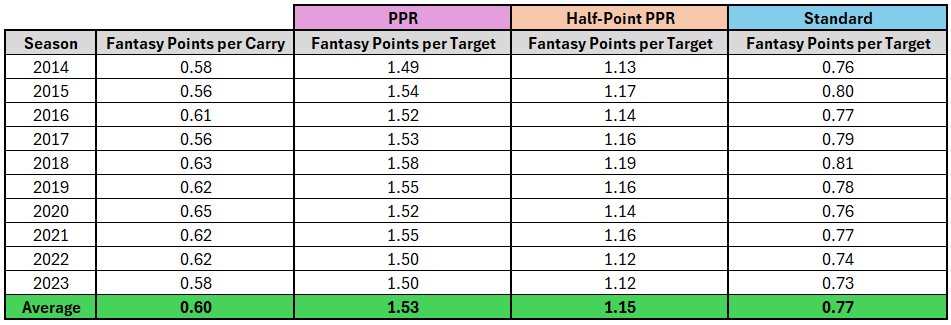
On average (over the past decade), a single rushing attempt has been worth about 0.60 fantasy points. A target has been worth about 1.53 fantasy points in PPR leagues. This means a target is roughly 2.55 times as valuable as a carry for a running back. Even in half-point PPR and standard leagues, a target is 1.92x and 1.28x more valuable than a carry, respectively.
To arrive at these figures, we simply total all fantasy points scored by RBs on the ground and divide them by the total number of carries over the past 10 seasons. For targets, we total all fantasy points scored by RBs through the air and divide by the total number of targets.
But we can do even better than this. Where an opportunity occurs on the field is just as important as whether it is a target or a carry. We can use the same methodology to isolate the values of Red Zone and non-Red Zone opportunities. (We’ll stick with PPR scoring for simplicity from here on).
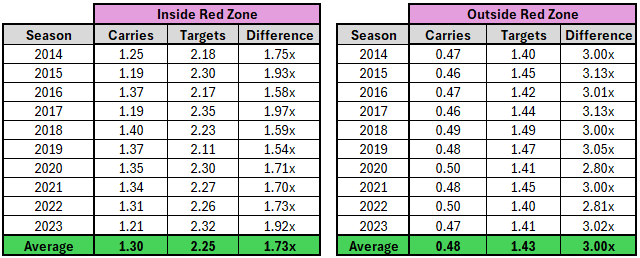
BROADLY SPEAKING, OUTSIDE OF THE RED ZONE, A TARGET IS WORTH 3.0X AS MUCH AS A CARRY IN PPR LEAGUES.
With the value of each carry and target so neatly quantified, we can use this information to paint a much better picture of how valuable each RB’s volume was in 2023. By multiplying an RB’s Red Zone carries by 1.30, their Red Zone targets by 2.25, their non-Red Zone carries by 0.48, and their non-Red Zone targets by 1.43, we can assign a single number to each player that describes how many fantasy points a typical player would have produced given their workload: weighted opportunity.
Again, you can do all of this manually yourself. You can also consult the Fantasy Points Data Suite, where weighted opportunity is available for free in the Basic Rushing tab.
I’ve pulled together the top 30 RBs by weighted opportunities per game (WO/G) from 2023 below:
Weighted Opportunities Per Game Leaders (2023)

Immediately, you might ask, “What is that differential column?” The differential column is simply the difference between a player’s WO/G and their actual PPR fantasy points per game. This is a measure of efficiency.
If a player was incredibly efficient or out-scored their weighted opportunity by a large margin, does that mean they’re very good, or just lucky? Well, it’s complicated. Generally, we should expect this to regress to either the mean (or at least the player’s career mean) from either direction. But it’s important to remember that differential represents a combination of luck and skill.
For example, Christian McCaffrey has maintained a well-above-average +3.0 differential over his career and has finished top-5 in differential during five of the past six seasons. Weighted opportunity is based on the average performance of all running backs. Unsurprisingly, one of the best RBs to ever play the game would consistently outperform the league average rate (roughly 0.0), and he’ll likely continue to do so. If we consider McCaffrey a “regression candidate,” we must understand he’d likely be regressing to his baseline average, not to the league average.
Christian McCaffrey has outperformed his weighted opportunity every season after his rookie year.
— Ryan Heath (@RyanJ_Heath) May 11, 2024
Meanwhile, peers like Fournette and Kamara fell off years ago.
Logo size = PPR/Game
Y-axis = Differential of PPR/G and Weighted Opportunity (overall efficiency)@FantasyPtsData pic.twitter.com/LkbWgASBDW
Still, most players at the polar extremes indeed tend to regress to the mean:
Of the top 30 least efficient seasons this past decade (min. 8 games), 29 of those players (96.6%) positively regressed (became more efficient) the following season. The average climb was from a -2.8 to a -0.3 differential.
Of the top 30 most efficient seasons, 80% regressed (became less efficient) the following season. The average fall was from a +4.3 to a +1.4 differential.
As you can see, an efficiency regression is inevitable — very efficient or very inefficient players are strongly pulled toward the average (0.0) in the following season. However, to know whether that matters for fantasy football, we must also understand what happens to volume when efficiency regresses — because volume ultimately drives fantasy production.
Does Positive Regression Matter?
Well, it’s complicated. Forgive me for the detour, but this topic is incredibly interesting and important. I’m about to walk you through a shockingly successful method of predicting fantasy football busts. But if all you’ve come here for is the player blurbs, feel free to scroll down to that section.
Let’s focus on a timely example. In 2022, Josh Jacobs averaged 19.3 FPG on a workload worth 17.1 weighted opportunities per game (+2.2 differential). In 2023, Jacobs averaged just 13.9 FPG on a nearly identical workload worth 17.2 weighted opportunities per game (-3.3).
From this, we might be tempted to target Jacobs with the expectation that he is due for positive (upward) regression in 2024, just like we avoided him last year as a likely negative regression candidate. I do expect Jacobs’ differential in 2024 to regress toward the average (0.0), or at least toward his career average (-0.4). But that glosses over some important realities.
Before we go all-in on positive regression, let’s test how that would have worked out over the past decade. How have RBs fared after having a season as inefficient as Jacobs just did?
Among high-volume RBs (averaged at least 15.0 WO/G, min. 8 games) who were massively inefficient (-2.0 differential or worse), only 27% went on to score at least 15.0 FPG the following season. That hit rate is abysmal despite 100% of those players positively regressing (becoming more efficient) in that next season — it just didn’t matter for fantasy football.
Yes, all players tend toward regression: an efficiency regression. But an inefficient season frequently leads to a reduction in volume (as the player might be washed). Remember, VOLUME IS NEARLY ALL THAT MATTERS at the RB position.
If you could guarantee me 17.2 WO/G for Josh Jacobs once again, I would be all in. The issue is that teams will respond to hyper-inefficient seasons by giving the player less opportunity.
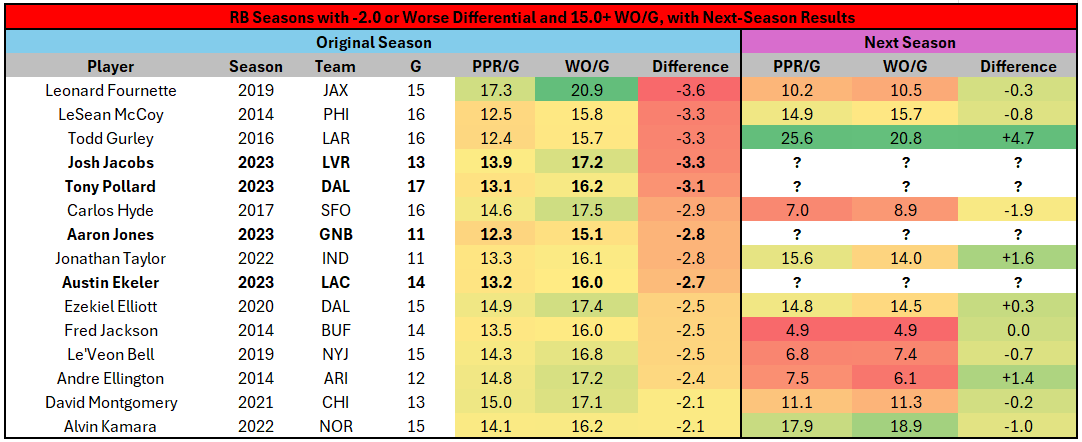
Fantasy managers chasing positive regression were only truly rewarded by two of these eleven players: a Year 3 Todd Gurley going from Jeff Fisher (arguably the worst offensive head coach of the modern era) to Sean McVay (arguably the best), and a still-inefficient Alvin Kamara propped up by the horniest check-down artist in the NFL on a team in the biggest salary cap crunch of the modern era.
We cannot, in good faith, argue that any of 2023’s hyper-inefficient RBs are experiencing similar circumstances. Even the excuses of injury for Tony Pollard and Austin Ekeler in 2023 ring hollow to me, as players like Jonathan Taylor and Andre Ellington from the above list similarly dealt with lower-body injuries, which was only used as further justification by their teams to limit their workloads. Again, teams will respond to extreme inefficiency.
I won’t mince words: Josh Jacobs, Aaron Jones, Tony Pollard, and Austin Ekeler have highly questionable bell-cow upside in 2024. Considering the former three are being drafted within the top-30 at the position, that RB2s are increasingly replaceable, and that Upside Wins Championships, I will be heavily fading them in 2024 drafts. It’s also worth noting that all four of these RBs changed teams via free agency, which itself has predictive value for diminished fantasy production at the position, and plays into the point about teams noticing when RBs are inefficient.
To be clear, I would not hold moderate inefficiency against players like Saquon Barkley (-1.1), Najee Harris (-1.1), or Rhamondre Stevenson (-1.7). The above analysis focuses on players who were outlier levels of inefficient. We should still think about volume when deciding whether to draft these players, but their relatively minor inefficiency is not a justification in itself to project a decrease in volume (as it is forJacobs, Jones, Pollard, and Ekeler).
Aside from avoiding hyper-inefficient players, the most important takeaway should be that volume, not efficiency, largely drives RB fantasy production (referring back to the top). Outside of extreme cases where the team cannot ignore the inefficiency (often leading to a refusal to re-sign the player, bringing in serious backfield competition, or demanding they take a pay cut), you should focus much more on the volume stat (weighted opportunity) than the efficiency stat (differential). Again, the RB position in fantasy football is all about predicting volume, so we should only truly care about efficiency insofar as it helps us do that.
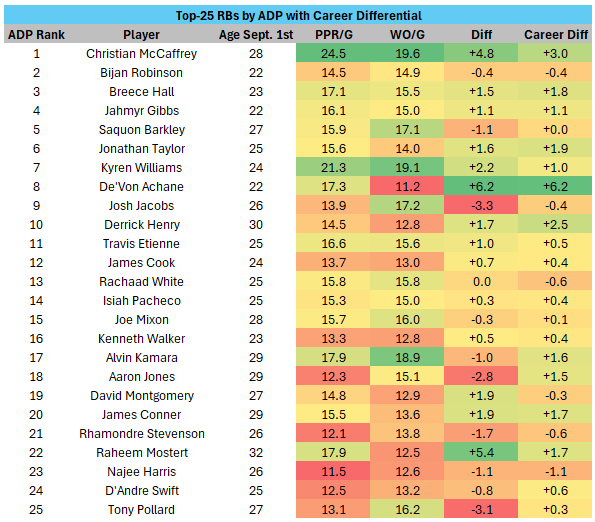
To provide an even larger sample and some context beyond 2023, here are the PPR/G, WO/G, and differentials for the top-25 RBs by early ADP, alongside their career differential:
Player Notes
1) Christian McCaffrey might be the final bell cow left standing in today’s NFL. His 19.8 WO/G in 2023 led all RBs, but it was only the 19th-best season of the past decade (min. 10 games). It’s hard to believe coaches once fed players like Devonta Freeman (21.1 WO/G, 2015) and Leonard Fournette (20.9 WO/G, 2019) more volume than McCaffrey had last year, but it underscores just how scarce (and therefore, valuable) fantasy assets like McCaffrey are today.
McCaffrey is the last RB that we have good evidence to believe is still capable of 20.0+ WO/G: previous contenders like Alvin Kamara, Derrick Henry, and Austin Ekeler have all dipped below 17.0 WO/G in at least one of the past two seasons, and new hopefuls like Breece Hall and Bijan Robinson are unproven at handling this type of volume. This makes McCaffrey the clear first overall pick in 2024 fantasy drafts. And luckily for holders of the 1.01, McCaffrey has shown no signs of slowing down when healthy, as his +3.3 differential over the past three seasons leads all RBs (min. 18 games).
Most top-5 finishes in differential between PPR/G and Weighted Opportunity/Game
— Ryan Heath (@RyanJ_Heath) May 18, 2024
[since 2018]
1A. Christian McCaffrey (4 seasons)
1B. Derrick Henry (4 seasons)
...
2A. Nick Chubb (2 seasons)
2B. Austin Ekeler (2 seasons)
2C. Aaron Jones (2 seasons)
Nobody else has multiple.
2) Though Bijan Robinson ranked outside the top-10 in WO/G in 2023, he’s not as far from being an elite fantasy contributor as it may have seemed last year. More opportunities around the Red Zone with Arthur Smith out of the picture (Robinson received only 27.4% of team red zone attempts in 2023, 46th among RBs) should do wonders to pump up Robinson’s WO/G and differential. If he’d received two-thirds of team red zone carries (Kyren Williams was at 80.9%), Robinson would have ranked as the RB4 with 17.4 WO/G. If he’d seen 75% of his backfield’s weighted opportunity (Williams was at 84%), Robinson would have ranked as the RB1 with 20.5 WO/G.
To further support Robinson’s likelihood of seeing an increased workload, we already know from my Age Curves research that RBs most often break out within their first three seasons in the league. But for Robinson (and Jahmyr Gibbs), we can get even more specific: over the past decade, nine of the top-10 biggest year-to-year workload increases (which resulted in at least 15 FPG over at least eight games played) occurred in Year 2 of the RB’s career.
9/10 of the biggest RB workload increases (that mattered) have occurred in Year 2.
— Ryan Heath (@RyanJ_Heath) May 11, 2024
Largest jumps in Weighted Opportunities/G
[min. 8 games, results in 15+ FPG, 2014-23]
1. *James Conner, 2018 [+16.8 WO/G]
2. *Kyren Williams, 2023 [+15.6]
3. *Devonta Freeman, 2015 [+15.4]
4.…
3) That list includes sophomore breakouts from the likes of James Conner, Kyren Williams, Devonta Freeman, Melvin Gordon, and Rachaad White — players the industry did not think particularly highly of after their rookie campaigns. Kendre Miller (RB48) and Tyjae Spears (RB38) have more upside to see a major volume increase than current ADP suggests.
4) We can say much of the same for Breece Hall, who led all RBs in FPG during wins. He also averaged 20.0 weighted opportunities in those games (RB4), compared to just 12.8 WO/G (RB19) in losses. The Jets trailed on 66.2% of their offensive plays last year (2nd-worst), but have a 9.5 win total for 2024 — implying significantly more scoring opportunities for Hall.
Fantasy points per game leaders in wins:
— Fantasy Points Data (@FantasyPtsData) May 2, 2024
Breece Hall on a competent offense could light the league on fire. pic.twitter.com/9Sb9UaDh1z
RBs returning from an ACL tear typically struggle; Hall wasn’t supposed to be 100% until halfway through the season. He still finished as the RB2 overall with a positive differential (+1.5) despite a joke of an offense and league-worst QB play.
The Jets simply failed to reach the red zone in several games, resulting in Hall’s lopsided win/loss splits — he handled 60% of the team’s red zone carries (RB11), or 79% from Week 10 on (RB5), but the Jets ranked dead-last with only 40 total rush attempts in the red zone all season. If the Jets were merely league-average, Hall would have averaged 17.5 WO/G (RB4), or 18.7 WO/G with his red zone usage in the second half of the year. Needless to say, some competent QB play out of Aaron Rodgers (who, as a reminder, won MVP in his last two healthy seasons) should fix all of Hall’s problems and put a Christian McCaffrey-like season squarely within his range of outcomes.
5) Though Saquon Barkley posted a relatively inefficient -1.1 differential in 2023, that’s actually fairly impressive considering he suffered a high-ankle sprain in Week 2 (an injury with which Jonathan Taylor posted a -2.8 differential at age 23). Barkley was also stuck on a brutally inefficient offense led by walking meme Tommy DeVito for much of the season. Trade that environment for the Eagles’ top-3 run-blocking offensive line (by adjusted yards before contact per attempt), and it’s easy to imagine Barkley posting a positive differential in 2024.
Even the high-value opportunities (targets and goal-line carries) in an offense where Jalen Hurts serves as the goal-line back could be better than I’d initially thought — D’Andre Swift averaged about 1.5x Barkley’s goal-line carries per game last year (14 attempts over 16 games compared to Barkley’s 8 over 14 games). All of this means Barkley is a decent value, but considering the Eagles’ superior target competition and the fact he has not reached 18.0 WO/G since 2019, his upside is a bit overstated. So, although I don’t mind his ADP, he is not a priority target of mine.
In 2023, no RB received more rushing attempts off the read option than D'Andre Swift - more than double that of Saquon Barkley.
— Fantasy Points Data (@FantasyPtsData) May 6, 2024
Saquon Barkley on all carries: 3.9 YPC
On the read option: 5.0 YPC (6th-best)
If this continues under Kellen Moore, it's great for Barkley. pic.twitter.com/drVZo94DXO
6) Kyren Williams came out of nowhere to post a top-25 season of the past decade by WO/G. He’s perceived as inefficient by much of the fantasy community, but his +2.2 differential ranked top-5 among relevant RBs last year. Round 3 pick Blake Corum threatens to take away a few drives here or there, but could just as easily be a paper tiger — the fantasy community significantly overreacted to Day 2 RBs last year as well.
Williams is appropriately priced in Round 2 for his median outcome (Corum taking a few drives each game and dinging his weighted opportunity slightly). But Williams’ path back to RB2 overall status is as simple as a rookie RB struggling in camp or failing to earn the trust of one of the most particular coaches in the league. This makes Williams a must-draft player in early Underdog contests, as he’s appropriately priced for his median outcome but offers all-important asymmetrical upside — a neutral-risk/high-reward bet.
7) Rhamondre Stevenson was significantly less efficient in 2023 (-1.7) than his previous career average (-0.1) due to a combination of injury, bad luck, and playcalling malpractice. With Antonio Gibson — who handled only one carry inside the 10-yard line last year — the only addition to the Patriots’ backfield, Stevenson is likely to re-capture goal-line work and see his WO/G grow. The Patriots finished next to the Jets in the basement of the league last year, logging just 2.6 red zone carries per game as a team. This offense has the upside to beat that mark with 3rd overall pick Drake Maye and a new coaching staff in town, making Stevenson a screaming value.
8) Jonathan Taylor’s reps were limited (especially early in 2023) after a disastrously inefficient (-2.8) and injury-laden 2022 season. However, his differential in our larger three-year sample (+1.4, 9th-best) and the Colts’ lack of investment at RB2 suggest this could be the year he returns to the efficient every-down bell-cow ways of his rookie season. Among the top-25 RBs by ADP, only Christian McCaffrey, Alvin Kamara, and Josh Jacobs have averaged more WO/G over the past three seasons.
Last year, Taylor averaged 16.2 WO/G in his healthy games with Zack Moss, who averaged 6.4 WO/G in those contests… so if Taylor can pick up 50% of Moss’s work, he theoretically has a path to 19.0+ WO/G. But Taylor’s problem is similar to Barkley’s: both are in great spots to post efficient rushing performances but will have to compete with hyper-mobile QBs (who also tend to target RBs less frequently) for scoring opportunities. Gardner Minshew averaged just 0.4 red zone rush attempts per game last year, while rushers of Anthony Richardson’s caliber like Josh Allen, Jalen Hurts, and Lamar Jackson averaged between 2.0 and 2.6 red zone attempts per game. I can tell myself the story where Taylor smashes, but as with Barkley, I think he’s a tad overpriced for how likely it is.
9) I was initially torn on what to do with De’Von Achane, but the closer I looked, the more confident I became. It takes only a glance at the above graphic to notice he’s a top regression candidate, having posted the single most efficient differential (+6.2) of the past decade. But that’s absolutely insane efficiency. Among RBs age 23 or younger drafted in Rounds 1-3 since 2014, only Achane, Kareem Hunt, Alvin Kamara, Ezekiel Elliott, Todd Gurley, Christian McCaffrey, Jonathan Taylor, and Tevin Coleman have posted a differential of +3.5 or better. (It’s no coincidence that Coleman, the one non-fantasy superstar on the list, was coached by Kyle Shanahan and Mike McDaniel that year — their system is incredible at getting elite efficiency out of RBs).
Returning to the previous detour about outlier efficiency leading to changes in volume (what we mostly care about), let’s take a look at the rookie RBs drafted in Rounds 1-3 who posted a +2.5 or better differential, and pay attention to what happened to their WO/G and FPG the following season:
De'Von Achane just had the most efficient rookie season ever, and could well be the next Alvin Kamara.
— Ryan Heath (@RyanJ_Heath) May 12, 2024
Among rookie RBs drafted Rounds 1-3 who outperformed their weighted opportunity by +2.5 PPG or more:
- 5/5 had a volume increase in Year 2
- 4/5 topped 20 PPG in Year 2 pic.twitter.com/t72wT3Q8Fr
Alvin Kamara was universally expected to regress after his similarly insane rookie season. And he sort of did — but only to his baseline (which ended up as a +3.3 differential). More importantly, the Saints couldn’t help but absolutely feed Kamara in Year 2 after seeing what a special player he was, resulting in over 20.0 WO/G. Every single player in the same stratosphere as Achane experienced a significant volume increase in their sophomore season.
Outlier talents (like Kamara and the others above) are the type of players who swing fantasy championships — Achane has the best chance of replicating that of any RB we’ve seen in years. The only players above who weren’t massive hits in Year 2 were J.K. Dobbins (who played zero games after brutally disfiguring his knee in the preseason) and Todd Gurley (who posted back-to-back seasons of 25.0+ FPG immediately after, the moment Jeff Fisher was fired).
An old and injury-prone Raheem Mostert and a Day 3 pick whose profile pales in comparison to Achane’s are his only obstacles to touches. And Achane could further convince the Dolphins of his ability to handle more volume after bulking up, which he’d never been able to do before as a former (incredibly well-decorated) track athlete. Or put another way, Achane received just 42.4% of his backfield’s weighted opportunity when active…if he’d received 70% of the work (about the same as Isiah Pacheco and Tony Pollard), he’d have averaged 19.3 WO/G behind only Christian McCaffrey — the opportunity available in this backfield is massive.
Achane has an extremely wide range of outcomes for an early pick, but his potential to break fantasy football is the highest of any RB outside of Round 1 — a screaming must-draft at cost. I’ll be drafting many shares.
10) He doesn’t stick out in 2023 overall, but in four games without Jerick McKinnon last year, Isiah Pacheco averaged 22.1 FPG and commanded a 14.9% target share. From Week 10 on (including playoffs), Pacheco ranked behind only Kyren Williams and Christian McCaffrey in WO/G. McKinnon is not currently on the roster, and his number was just given to rookie WR Xavier Worthy. The Chiefs have spent no draft picks at the position and have no obvious pass-catching RB. Pacheco appears an excellent mid-round option compared to players like James Cook and Kenneth Walker, who have much narrower paths to top-5 volume.


