
Stay ahead in your fantasy football league by understanding the crucial strength of schedule changes that could alter player performance at the quarterback position!
Which quarterbacks have the toughest or easiest fantasy football schedules this year? Which quarterbacks had the toughest or easiest schedules last year? Or what about the toughest or easiest schedules in the fantasy postseason this year? Or to start the season? Which quarterbacks saw their schedules improve the most or least? How big of an impact was that change in schedule? Can we quantify that change in real terms using fantasy points?
Luckily for our subscribers, we can answer all of these questions and more. But in order to do so, we first had to quantify strength of schedule. This is typically done by calculating a defense’s FPG allowed average and then looking at the average for all players over an entire season. This will also be our approach. However, we’ll be taking things one step further – we’re going to use a control for the opposing offense by measuring FPG over an opponent’s average.
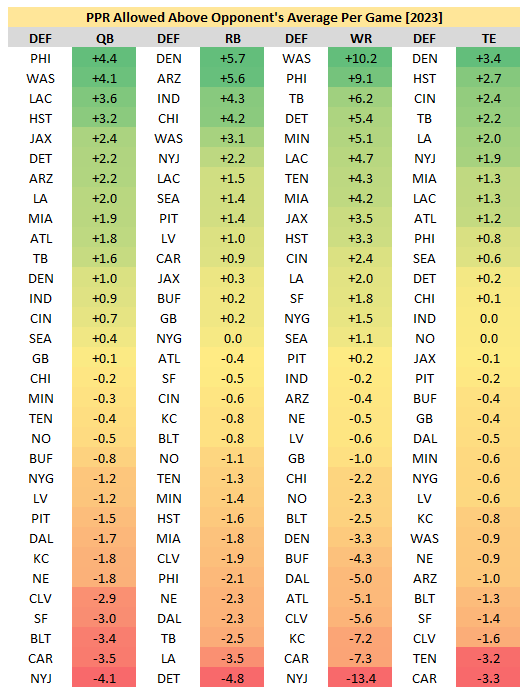
For instance, last season, opposing quarterbacks averaged +4.4 fantasy points per game over their season-long average when facing the Eagles, which ranked worst in the league defensively. (Philadelphia was the most favorable fantasy matchup for opposing quarterbacks — worth, on average, an additional 4.4 fantasy points per game.)
On the opposite end of the spectrum, quarterbacks fell short of their season-long average by 4.1 points when facing the Jets, which ranked best in the league. (In other words, the Jets were the toughest fantasy matchup for opposing quarterbacks.) Calculating these numbers for all teams and then applying the full-season average for all players quantifies in real terms which players had the easiest and most difficult schedules for fantasy last year. We can also use these numbers to project out strength of schedule for each team and each position in 2024.
Ah, then, you might ask: “Do defenses get defined as ‘tough’ matchups because bad QB play against them is dragging the numbers down?” Not for this study. The strength of schedule (SOS) average used in this study controls for the quality of an opponent by eliminating a QB’s own performance against a defense when measuring that individual’s SOS. So this SOS study filters out the notion that the quarterback being studied was responsible for his own schedule difficulty — I measure the QB’s SOS by measuring how his peers performed relative to their average against a particular defense. In essence, the defenses playing Zach Wilson don’t simply look tough statistically because they were playing Zach Wilson during a bad season, because I control for that.
Calculating these numbers for all teams and then applying the full-season average for all players quantifies in real terms which players had the easiest and most difficult schedules for fantasy last year. We can also use these numbers to project out strength of schedule for each team and each position in 2024.
While this methodology isn’t perfect — of course, roster turnover and coaching changes will complicate things — strength of schedule doesn’t not matter. This data is still far more actionable than it is not. In fantasy football — like in poker — there may only be small edges to be gained, but those small edges can be compounded to yield a massive advantage. And they must be taken advantage of… and are, by the most dominant players. That’s the case with strength of schedule. It’s another small edge to be realized, and at the polar extremes, it might matter a lot more than you’d expect.
Here’s an example: last season, Jared Goff had the 4th-toughest strength of schedule of any QB last year. His average matchup was worth -0.41 [team quarterback] FPG. Because he was responsible for just about 100% of the fantasy points generated by Detroit’s quarterbacks last year (in games he started), we can say that – adjusted for strength of schedule, or if he had a perfectly average strength of schedule last year – he would have scored an additional 0.41 fantasy points per start.
Looking forward, Goff has the 7th-softest projected strength of schedule in 2024 (+0.39). In contrast to last year, his schedule is worth an additional +0.80 fantasy points per game in real terms. Essentially, if he had this schedule last year, he should have averaged 18.5 fantasy points per start, which would have ranked 11th-best at the position instead of 14th-best.
Clearly, strength of schedule – something totally outside of a player’s control and entirely due to luck – can have a big impact for fantasy.
Other Positions
Running Backs (click here)
Wide Receivers (click here)
Tight Ends (click here)
Best Overall Schedule (2023)
1. Justin Fields, Average Matchup: +0.79
2. Will Levis (+0.79)
3. Bryce Young (+0.79)
4. Sam Darnold (+0.77)
5. Kyler Murray (+0.76)
Worst Overall Schedule (2023)
1. Tua Tagovailoa (-1.09)
2. Justin Herbert (-0.84)
3. Joe Burrow (-0.82)
4. Jared Goff (-0.41)
5. Jalen Hurts (-0.34)
2024 Schedule
PDF and CSV downloads available here.
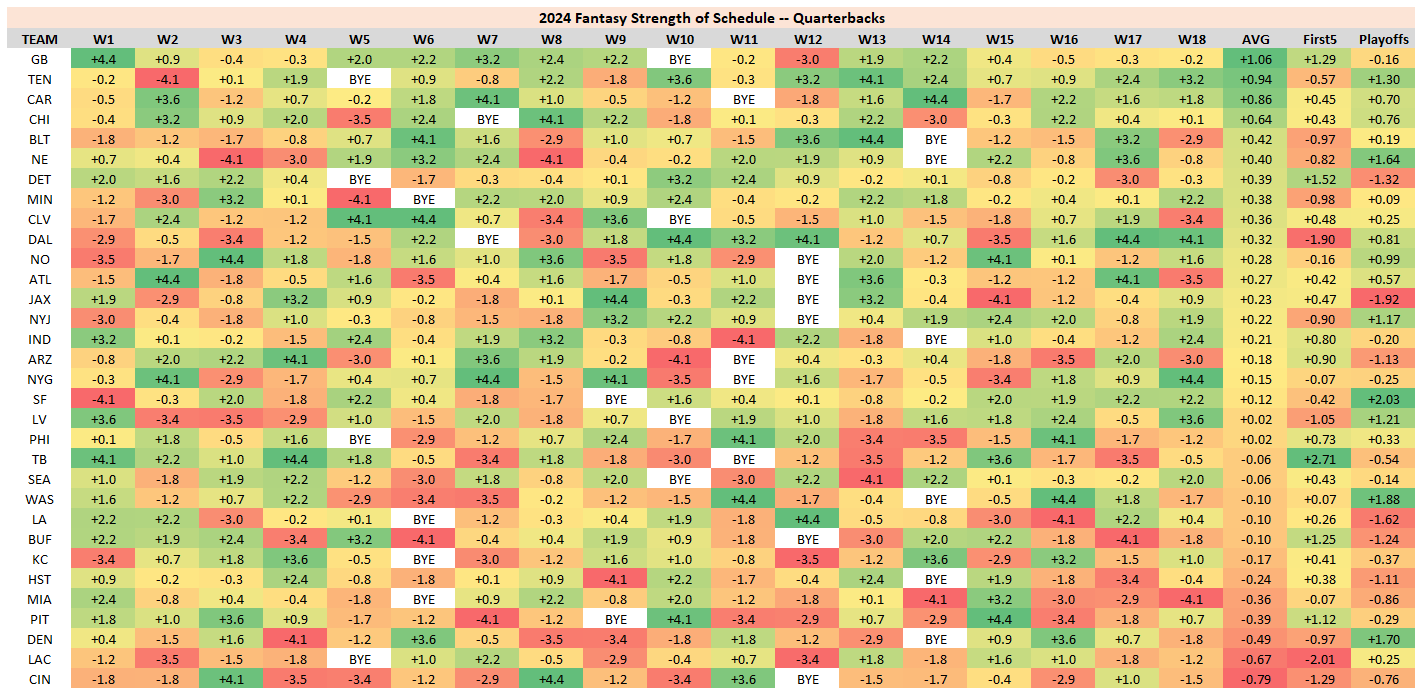
Best Overall Schedule (Weeks 1-17)
1. Jordan Love (+1.06)
2. Will Levis (+0.94)
3. Bryce Young (+0.86)
4. Caleb Williams (+0.64)
5. Lamar Jackson (+0.42)
Worst Overall Schedule (Weeks 1-17)
1. Joe Burrow (-0.79)
2. Justin Herbert (-0.67)
3. Bo Nix (-0.49)
4. Russell Wilson (-0.39)
5. Tua Tagovailoa (-0.36)
Off to a Hot Start (First Five Games)
1. Baker Mayfield (+2.71)
2. Jared Goff (+1.52)
3. Jordan Love (+1.29)
4. Josh Allen (+1.25)
5. Russell Wilson (+1.12)
Slow Starters (First Five Games)
1. Justin Herbert (-2.01)
2. Dak Prescott (-1.90)
3. Joe Burrow (-1.29)
4. Garder Minshew / Aidan O’Connell (-1.05)
5. J.J. McCarthy (-0.98)
Best Playoff Schedule (Weeks 15-17)
1. Brock Purdy (+2.03)
2. Jayden Daniels (+1.88)
3. Bo Nix (+1.70)
4. Drake Maye (+1.64)
5. Will Levis (+1.21)
Worst Playoff Schedule (Weeks 15-17)
1. Trevor Lawrence (-1.92)
2. Matthew Stafford (-1.62)
3. Jared Goff (-1.32)
4. Josh Allen (-1.24)
5. Kyler Murray (-1.13)
Schedule Change (In Real Points)
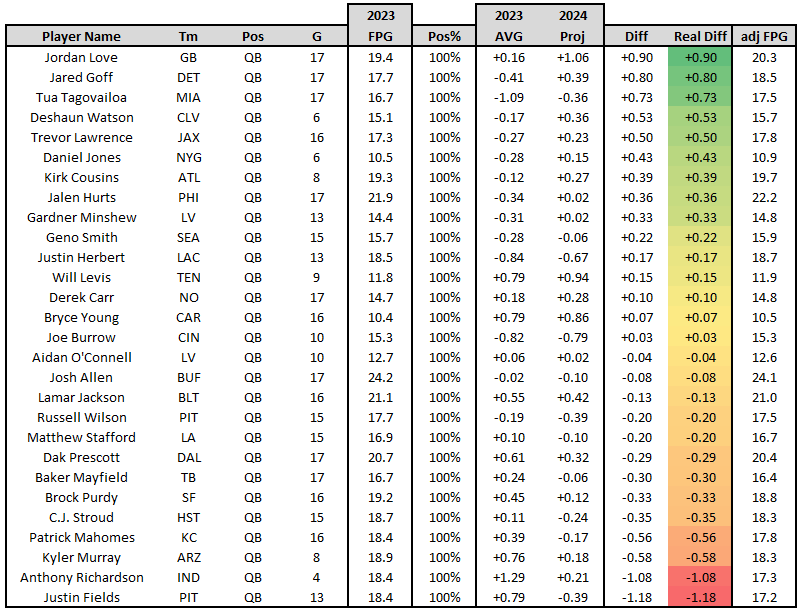
Most Improved Schedule
1. Jordan Love (+0.90)
2. Jared Goff (+0.80)
3. Tua Tagovailoa (+0.73)
4. Deshaun Watson (+0.53)
5. Trevor Lawrence (+0.50)
Least Improved Schedule
1. Justin Fields (-1.18)
2. Anthony Richardson (-1.08)
3. Kyler Murray (-0.58)
4. Patrick Mahomes (-0.56)
5. C.J. Stroud (-0.35)
Thoughts/Notes/Dank Stats
1) Jared Goff doesn’t only have the 2nd-most improved strength of schedule, but he’ll also benefit from playing 14 of his 17 games in a dome. The protection from inclement weather that the dome provides benefits all QBs, but perhaps “Babyhands Goff” benefits more than any other QB.
Jared Goff [2022-2023]
— Fantasy Points Data (@FantasyPtsData) May 16, 2024
in a dome:
+ 19.5 FPG (~QB6)
+ 104.6 passer rating (~QB3)
outdoors:
+ 13.0 FPG (~QB28)
+ 86.5 passer rating ( ~QB25) https://t.co/UprKUdTUhP
Unfortunately, two of those three outdoor games come in the playoffs. And Goff’s postseason schedule ranks 3rd-worst of any QB (-1.32). Ultimately, he’s a tremendous value in best ball leagues (ADP: QB16), but (given the tough postseason schedule) only a slight value in tournament-style best ball leagues. In start/sit leagues, he could be a strong value in start/sit leagues, but perhaps only if you have a dependable QB2 or a deep free agency pool to stream from during his road games.
Jared Goff has played in exactly 17 home games and 17 away games over the last two seasons
— Scott Barrett (@ScottBarrettDFB) May 13, 2024
Home
+ 44 total touchdowns
+ 21.5 fantasy points per game (~QB4)
Away
+ 17 total touchdowns
+ 13.3 fantasy points per game (~QB38)
As a final aside, I also love the odds on Goff to win MVP (+4,000, 17th-best odds). He ranks 2nd among all QBs in passing yards over the last two seasons (9,013), while also ranking 3rd in passing touchdowns (59). Keep in mind, that’s despite the fact that Detroit has scored the 2nd-most red zone rushing touchdowns over the same span (45). It might only take a David Montgomery injury or an increased pass-heavy rate inside the red zone to get Goff firmly within the MVP conversation.
2) Last season, Jordan Love ranked 5th among all QBs in fantasy points per start (19.4). And he seemed to get better as he grew in experience, hitting at least 17.5 fantasy points in 8 of his last 9 games (average: 20.9). He’ll benefit from the position’s most-improved strength of schedule (+0.90) and seems like a safe bet to pay off his QB10 ADP.
3) Last season, Brock Purdy led all QBs in fantasy points per opportunity (0.60), and also ranked 7th-best in FPG (19.3). He’s an extreme value, priced as just the QB12 in Underdog drafts despite having the position’s best fantasy playoff schedule (+2.0).
4) Jayden Daniels’ cushy playoff schedule (+1.88, 2nd-best) is another reason to like him, on top of the fact that he’s also probably the single-most mispriced player at the position. Daniels – last year’s Heisman winner – possesses immense fantasy upside. He averaged 40.0 FPG last season, which ranks as the 2nd-most of any Power 5 QB since at least 2016. And his 1.20 fantasy points per dropback also ranks 2nd-best since 2014. And Kliff Kingsbury’s fast-paced, up-tempo, pass-heavy offense seems like the ideal fantasy environment – Kingsbury's Cardinals ranked 4th in dropbacks per game (41.2) throughout his 4-year tenure. Right now, Daniels is priced as the QB13 on Underdog, but is closer to QB7 based on our projections.
5) Justin Herbert should probably be faded in start/sit leagues, although he could make for an attractive trade target mid-season (if he isn’t already available on waivers at that point). Herbert has the 2nd-toughest strength of schedule this season (-0.67), and an especially tough early-season start to his schedule (only one above-average matchup through his first seven games). In addition to this, I worry about Herbert’s volume under new HC Jim Harbaugh. The Chargers have typically ranked top-5 in pass volume over the last three seasons, but they could be closer to bottom-5 this year. Factor in the departures of Keenan Allen, Mike Williams, and Austin Ekeler, as well as the tough strength of schedule, and I have a hard time getting excited about Herbert’s QB16 ADP.
Justin Herbert, FPG Rank
— Scott Barrett (@ScottBarrettDFB) March 27, 2024
2023: QB12 (18.6)
2022: QB11 (18.4)
2021: QB3 (23.3)
Justin Herbert, FPG Rank (if the Chargers were perfectly average in dropbacks per game)
2023: QB16 (17.9)
2022: QB27 (14.6)
2021: QB10 (20.7)
6) Bo Nix has the 3rd-toughest strength of schedule of any QB (-0.49), but that gets offset by the position's 3rd-softest playoff schedule (+1.70). Priced as just the QB31 on Underdog, he's easily one of the best high-floor values at the position. Sure, he might not be very talented, but HC Sean Payton has coaxed fringe-QB1 production out of many lesser talents (with a similarly poor supporting cast) throughout his career.
Sean Payton QBs [2018-2023]
— Scott Barrett (@ScottBarrettDFB) April 26, 2024
Taysom Hill: 20.5 fantasy points per start
Drew Brees (age: 39-41): 19.8
Russell Wilson (washed 3 years ago): 18.0
Trevor Siemian: 18.0
Jameis Winston: 17.2
Teddy Bridewater: 17.1
This is a sneaky amazing fantasy landing spot for Bo Nix.
7) Tua Tagovailoa has the 3rd most-improved schedule of any QB, worth, in real terms, a boost of +0.73 FPG. He’s priced as just the QB14 on Underdog, which seems weird, given that he led the league in passing yards last year. And it's especially weird given that he perfectly embodies the “better in best ball” archetype – he averages 25.8 FPG in his top-33% of games over the last two years. For perspective, Trevor Lawrence (QB15) has exceeded 25.8 fantasy points only three times in his 50-game career.
8) Last year’s Exodia QB Anthony Richardson has the least-improved schedule (-1.08) of any likely starter. And I just don’t care at all. Basically – based on an admittedly too-small sample size from last year – he has a massive distance to fall to still easily finish as a top-6 QB.
Fantasy Points per 4 Full Quarters [2023]
— Scott Barrett (@ScottBarrettDFB) May 20, 2024
1. Anthony Richardson (29.2)
2. Josh Allen (24.2)
3. Jalen Hurts (22.5)
Fantasy Points per Dropback [2023]
1. Anthony Richardson (0.76)
2. Josh Allen (0.64)
3. Brock Purdy (0.63)
9) Kyler Murray has the 3rd-least-improved schedule of any QB (-0.58), and again, I don’t really care. Murray is priced as the QB8, after finishing 9th in fantasy points per start last year (18.9). This passing attack should take a gigantic step forward this year, following the addition of Marvin Harrison Jr. And Murray offers significantly more rushing upside than he showed us last year, now 17 months removed from ACL surgery.
10) Patrick Mahomes has the fourth-least improved strength of schedule of any quarterback this year, worth 0.6 FPG off of his per-game average in real terms. In other words, he ranked just 15th among all quarterbacks in schedule-agnostic FPG (17.8). So, yes, it’s a little weird that he is currently the ADP QB4 on Underdog.
11) Last season, from Week 6 on, Dak Prescott led all QBs in FPG (24.1). And don’t be surprised if Prescott follows a similar trend this year… Prescott is an undeniable value at his QB9 ADP, but if you fail to snag him on draft day, you may be able to buy him at a discounted price closer to mid-season. The Cowboys have the 2nd-toughest schedule through the first five weeks of the season (-1.9), but that improves to 2nd-softest from Week 6-on (+1.34).
12) Baker Mayfield could be a reliable streamer to start the year. He faces three bottom-6 defenses throughout his first four games (average: +2.9).


