
Hello, and welcome to the Week 14 Usage Report, formerly known as the XFP Report, but for you long-time readers it’s the exact same article with a different name. If you’re unfamiliar with XFP, I’ll get to that in a little bit.
What is this article?
Every week we’re going to be telling you which players are seeing the best volume for fantasy, typically measured by Expected Fantasy Points (XFP). We’ll be telling you who the best buy-low and sell-high candidates are, typically measured by Points Above Replacement (PAR), or the differential between actual- and expected fantasy points. This is an especially effective approach in DFS, where players are typically priced by production rather than volume, though PAR will regress to the mean. And (at the end of the article) we’re going to be telling you who the best volume-per-dollar DFS plays are.
What is XFP?
You can access our full XFP database (which includes other advanced stats like air yards, deep targets, end zone targets) here.
Expected fantasy points (XFP) is flat-out the best and most comprehensive way of measuring a player’s volume. It’s telling you – based on a player’s unique usage – how many fantasy points that player should have scored. It’s telling you how many fantasy points a perfectly league-average RB, WR, or TE would have scored with that same exact volume. It looks at every individual carry by down and distance and distance from the end zone and every individual target by depth of target and distance from the end zone, and then cross-references each carry and target to each carry and target with those specific qualifiers over a multi-year sample to tell you what exactly those carries and targets are worth (historically).
Expected touchdowns (XTD), same thing. RBs score from the one-yard line on 54% of their attempts. RBs score from the 17-yard line only 3.6% of the time. So why ever use “red zone carries,” which treats both carries the same, as a fantasy stat? I have no idea.
Why doesn’t everyone point to XFP in their fantasy research? I have no idea. Once you have XFP and XTD you can contrast that with a player’s actual fantasy points or actual touchdown total to tell you how efficient a player has been (PAR). This is especially useful in highlighting regression candidates, buy-low targets, and mispriced players for DFS.
Through 12 weeks of action, here are the top 30 players in expected fantasy points (XFP) per game:
The Top 30
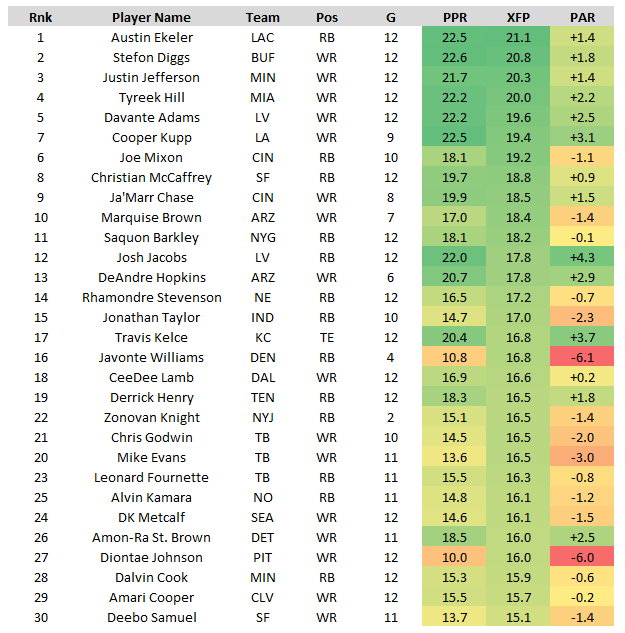
Click here to see the full list.
Christian McCaffrey, RB, San Francisco 49ers
[FPG: 19.7, XFP: 18.8, Diff: +0.9]
Christian McCaffrey has played in two games with the 49ers and without Elijah Mitchell.
Here are his numbers in those games, and where they would rank over the full season:
81% snap share, would rank 2nd-best
72% route share, would rank best (next-closest RB at 59.9%)
17.5 carries per game, would rank 6th-best
9.5 targets per game, would rank best (next-closest RB at 8.7)
72% backfield carry share, would rank 10th-best
28.8% target share, would rank best (next-closest RB at 21.2%)
25.2% receiving yardage market share, would rank best (next-closest RB at 16.9%)
38.6% team XFP market share, would rank best (next-closest RB at 29.4%)
8.0 receptions per game, would rank best (next-closest RB at 7.1)
80.0 rushing YPG, would rank 6th-best
67.5 receiving YPG, would rank best (next-closest at 47.0)
147.5 YFS/G, would rank best (next-closest at 136.2)
28.8 XFP/G, would rank best (next-closest RB at 21.1)
31.8 FPG, would rank best (next-closest at 22.4)
If it’s not already obvious, what I’m trying to say is this – if this usage sticks, McCaffrey should have a weekly projection at least +20% higher than any other player in fantasy. In comparison to fantasy football’s current RB1 Austin Ekeler, McCaffrey’s volume (XFP) is +36.5% better, and he’s been +41.9% more productive (by FPG).
Basically, within this perhaps dangerously small 2-game sample, McCaffrey is exactly who we hoped he would be. He is who he was in 2019 – when Kyle Allen (who I consider comparable to Brock Purdy) started in 12 of 16 games – and every season after that when fully healthy.
Which is to say, McCaffrey is Exodia; McCaffrey is Meta Knight; McCaffrey is indistinguishable from peak-LaDainian Tomlinson; McCaffrey is possibly a fantasy football auto-win for the playoffs. Or, at least so long as this usage sticks.
CMC (w/ 49ers, w/out Elijah Mitchell) vs. Austin Ekeler
— Scott Barrett (@ScottBarrettDFB) December 6, 2022
+81% snap share vs. Ekeler's 64%
+72% route share vs. Ekeler's 55%
+17.5 carries/G vs. Ekeler's 11.5
+9.5 targets/G vs. Ekeler's 8.7
+147.5 YFS/G vs. Ekeler's 96.1
+28.8 XFP/G vs. Ekeler's 21.1
+31.8 FPG vs. Ekeler's 22.4 https://t.co/ayzJNKQ3Nw
Quick Hits
D’Andre Swift is back? D’Andre Swift is back! Last week – in his first game off the injury report since Week 1 – he played on 51% of the team’s snaps, handling 14 of 27 carries (62%) and 6 of 11 targets out of the backfield (55%). So, granted, at least for now it’s still glaringly a committee backfield – Swift handled 57% of the backfield XFP to Jamaal Williams’ 22% and Justin Jacon’s 19%. But, believe it or not, that usage was still good enough for 22.4 XFP, which ranked 3rd-most among all RBs on the week. And the week prior (on just 34% of the team’s snaps), Swift ranked 9th with 18.6 XFP… Despite the gross 3-way committee – which, mind you, might tilt more in Swift’s favor as he returns to full health – there’s still some upside for Swift. Detroit ranks 3rd in total team RB XFP (28.8), and 57% of that would equate to 16.4 XFP/G, which would rank 10th-best among all RBs.
Last week, Amari Cooper earned a 42.9% target share (3rd-highest on the week), but scored just 8.0 fantasy points. So, although the results weren’t great, it was encouraging to see Deshaun Watson lock on to Amari Cooper in his Browns debut… Throughout his career, Deshaun Watson’s WR1 averages 19.3 FPG (~WR5), and has never averaged less than 17.2 FPG (~WR10) in any season of his career.
Greg Dulcich was the primary beneficiary of the Courtland Sutton injury – he saw 60% of the team's first read targets in Week 13, which was the highest mark by any TE in any week this season. Dulcich ranks only 10th among TEs in targets per game (5.7), but leads the way in deep targets per game (1.7). To me, that means he’s an underrated upside-play for DFS tournaments every single week. He ranks only 9th in salary on DraftKings this week ($3,400), despite ranking 8th in YPG (45.6), just 1.6 off of George Kittle (47.2), and only 11.7 behind Denver WR1 Courtland Sutton (57.3).
By all appearances, it seems as though James Conner is fully back to being a highest-end bell cow, reprising the role he had at the end of last season when he averaged 23.6 FPG over his final 7 games to close out the year… Over his last three games, Conner has played on 89.5% of the team’s snaps (most by any RB over this span) while handling 90.6% of the backfield XFP (also most), and averaging 20.7 carries, 3.7 targets, 18.0 XFP/G (6th-most), and 19.7 FPG (5th-most). I’d want to bet on this continuing, and him returning mid-range RB1 production throughout the remainder of the season.
Prior to Dallas Goedert’s injury, Philadelphia TEs combined for a 24.1% target share. Since then, that’s dropped to just 6.9%. So, where did all of those missing targets go? Mostly to DeVonta Smith, who has seen a significant jump in target share (24.1% to 30.2%) following Goedert’s injury… I think A.J. Brown is clearly the team’s WR1 from a fantasy perspective, but I also think it might be a lot closer than anyone seems to realize. Smith has led the Eagles in first-read target share in 3 of his last 5 games, but Brown has led the team only 3 times all year. And Smith has seen at least 8 targets in 5 of his last 6 games, but Brown has seen at least 8 targets only once over his last 5 games.
Chigoziem Okonkwo hit a season-high in route share last week (57%). Since Week 9, he leads all players at all positions in YPRR (3.84), just ahead of Davante Adams (3.69).
Since Week 6, Cincinnati ranks 2nd in pass rate over expectation (+10.9), up from +3.0% (12th-most). And the Bengals have won 6 of their 7 games over this span… Over the last two seasons, Joe Burrow averages 29.3 DK FPG with a 0.727 win percentage in all games (11) Cincinnati has exceeded a +3.5% pass rate over expectation (PROE). The rest of the time, he averages just 18.9 DK FPG with a 0.588 win percentage (17 such games). For perspective, the Chiefs currently lead all teams in PROE (+13.8%), and Patrick Mahomes currently leads all QBs in DK FPG (27.5).
Tony Pollard is currently the most efficient player in fantasy (PAR: +4.7). And I don’t know what’s more absurd – the fact that he ranks 10th in FPG (16.3) despite ranking just 26th in snaps per game (32.6) and 28th in XFP/G (11.6). Or the fact that Pollard can be this productive and efficient – so much better than Ezekiel Elliott – and still rank behind him in XFP/G (11.8 vs. 11.6)… Since Week 8, Pollard averages a ridiculous 25.0 FPG on just 15.1 XFP/G. But that hasn’t resulted in any better usage for him. Over the last two weeks, Elliott has played on 53% of the team’s snaps (to Pollard’s 50%), while handling 50% of the backfield XFP (to Pollard’s 50%)… As 9.0-point favorites against a generationally bad Texans run defense, expect Pollard to be uber-chalky this week. And for Elliott to be touted as a very-viable leverage play.
Since Taylor Heinicke took over for Carson Wentz in Week 7, Terry McLaurin ranks 4th in target share (30.8%), behind only Davante Adams (33.9%) and Stefon Diggs (32.1%).
Last week, Drake London earned a 50% target share – the highest target share of any player in any week this season. Unfortunately, I’m not very optimistic on London’s fantasy potential throughout the remainder of the season, because: 1) The Falcons run a sloth-paced offense – Atlanta ranks 3rd-worst in plays per game (59.5). 2) Their offense is WW2-era levels of run-heavy – Atlanta ranks 2nd-worst in pass rate over expectation (-11.5%). 3) Their QB is terrible – Marcus Mariota ranks worst of 33-qualifying QBs by off-target throw rate (20.3%). However, in a different world, he could have been a league-winner… London ranks 11th in target share (27.9%) but only 36th in total targets (81). By target share, London would be leading the league in targets (146) if Atlanta had as many pass attempts as the Buccaneers.
Cole Kmet earned a season-high 82.1% route share last week. Over his last five games with Justin Fields under center, he’s earned 23.2% of the targets, resulting in a 27.3% yardage share and 14.8 FPG. If over the full season, those numbers would rank: best (by route share), 4th-best (by target share), 2nd-best (by yardage share), and 2nd-best (by FPG).
I worry a little bit about Justin Fields’ Exodia-status this week… He had only 4 designed runs in Week 13, down from an average of 9.6 per game over his 5 games prior to injury. The plus side is that Fields still rushed for 71 yards plus a touchdown, while also leading all QBs on the week in YPA (10.2). But still, a more conservative approach with Fields following his injury would be beneficial in the long-term, but maybe a little unideal for greedy owners like me in the short-term.
Jameson Williams ran only 4 routes in his Week 13 NFL debut. So, you can’t start him yet, but make sure you add him everywhere you can.
I don’t think we’ll be able to reliably trust any Kansas City RB at any point this season. Sure, Isiah Pacheco handled 14 of 22 carries and 2 of 4 targets out of the backfield last week. But Jerick McKinnon handled all of the backfield’s 3 opportunities inside the 5-yard-line, and Pacheco played on just 14% of the team’s snaps inside the red zone.
Raheem Mostert overtook Jeff Wilson in Week 13, handling 56% of the backfield XFP to Wilson’s 44%. Across their previous two games together, Wilson bested Mostert 58% to 42%. But then again, this was a really weird game – both RBs combined for just 9 carries and 2 targets. It’s possible this is just a perfectly even 50/50 committee (with some week-to-week variance) or that Mostert is indeed the RB1A moving forward. But to me the bigger takeaway is Mike McDaniel’s willingness to abandon the run, and how much of a cheat code Tua Tagovailoa plus his pass catchers have been in DFS… Miami led the league in pass rate over expectation in Week 13, with +20.0% (also the 5th-highest mark by any team in any week this season). The Dolphins average a +8.3% PROE in games Tua Tagovailoa played in full, which would rank 3rd-most among all teams if over the full season. He currently ranks 1st in fantasy points per dropback (0.58), and across his 8 healthy starts this season, would rank 1st in passing YPG (320.4) and 5th in FPG (22.5).
Last week Garrett Wilson gained 162 yards (2nd-most) on 253 air yards (most), 15 targets (most), and 29.0 XFP (most). So, yeah, I’m feeling pretty good about my call a few weeks ago, when I said that Wilson was “a probable league-winner.” Except now I’m going to revise that to: "Garrett Wilson is probably 2022's 2021 Amon-Ra St. Brown, and very well could be the top overall league-winner this year.” Wilson will very likely be the single-highest owned player on DraftKings this week, but I expect to come in higher than the field (probably 100% on non-Milly Maker lineups).
Garrett Wilson w/out Zach Wilson
— Scott Barrett (@ScottBarrettDFB) December 6, 2022
11.0 targets per game
9.6 first read targets per game
117.0 air yards per game
20.1 XFP/G
20.3 FPG
94.2 YPG
1.6 MTF/G
If over the full season, those numbers would rank:
2nd-best
best
6th-best
4th-best
3rd-best
7th-best
6th-best
2nd-best
Amon-Ra St. Brown is this season’s Cooper Kupp.
Amon-Ra St. Brown [last 13 healthy games]
— Scott Barrett (@ScottBarrettDFB) December 5, 2022
+10.9 targets per game
+24.6 FPG
+10+ target games: 11 of 13 (85%)
+ games w/ 15.0+ PPR: 12 of 13 (92%)
Cooper Kupp [2021]
+11.2 targets per game
+25.9 FPG
+10+ target games: 14 of 17 (82%)
+games w/ 15.0+ PPR: 16 of 17 (94%)
Last season, Mark Andrews averaged 9.2 first-read targets per game when Tyler Huntley started. For perspective, Davante Adams is currently averaging 9.2 first-read targets per game.
Mark Andrews [2021-2022]
— Scott Barrett (@ScottBarrettDFB) December 5, 2022
Tyler Huntley Led Team In Pass Attempts (6 games)
28.4% target share
91.8 YPG
20.0 FPG
All Other Games (22)
19.1% target share
66.5 YPG
15.2 FPG
We saw something of a coming-out party for James Cook in Week 13, who led the team in both carries (14) and targets (6), and he ended the week with the 13th-most XFP of any RB (15.8). That’s the good news. The bad news (especially for Devin Singletary) is that this is now looking like a three-way committee backfield – Singletary still led the team in snaps (33), Cook was right behind him (32), but Nyheim Hines was also involved (20). And so, I question how much upside there might be for Cook in this role, because Buffalo ranks 7th-worst in team RB XFP/G (20.6)… On the plus side, it does seem as though Buffalo is making a more concerted effort to get their RBs involved. Perhaps because QB Josh Allen is banged up (UCL injury) and has been in a serious slump over the last several weeks (see below). Over the last three weeks, Buffalo RBs are averaging 26.0 carries per game, up from 17.1 (a +52% increase)… Ultimately, I envision this will remain a gross committee backfield for the remainder of the season. But there is definitely some upside here if Cook (their most talented RB) can walk away with a bell cow role. Remember, over Buffalo’s final 7 games last season (including the playoffs), Singletary played on 84% of the team’s snaps, averaging 19.7 FPG. For perspective, those numbers would have ranked best and 4th-best if over the full season.
Josh Allen [Weeks 1-6]
— Steven ORourke (@callmesteveo7) December 7, 2022
109.1 passer rating (2nd-best)
13.4% off-target throw% (5th-best)
2.9% turnover-worthy throw% (8th-best)
Josh Allen [Weeks 7-13]
80.6 passer rating (3rd-worst)
18.1% off-target throw% (4th-worst)
5.9% turnover-worthy throw% (worst)
(of 28 qualifiers)
The biggest cheat code in DFS this season is playing at least one of Josh Jacobs or Davante Adams on every single lineup:
"There's a skeleton key to winning DFS GPPs every year. This year's skeleton key: at least one of Davante Adams / Josh Jacobs on every lineup."
— Scott Barrett (@ScottBarrettDFB) December 5, 2022
Quote from @SmolaDS. And @JMToWin gets credit for being on it first https://t.co/8eUZSmfWGK
Rhamondre Stevenson remains a must-start top-3 RB any week Damien Harris misses. And still an easy top-10 option even if Harris plays.
Rhamondre Stevenson (Week 13)
— Scott Barrett (@ScottBarrettDFB) December 6, 2022
+98.0% snap% (most by any RB in any week this season)
+81.6% route% (4th-most...)
+97.4% backfield XFP% (5th-most...)
+23.5% target share **
**only two players have hit a 22% target share in each of their last 6 games:
+Rhamondre
+Terry McLaurin
Since Week 7, Darius Slayton ranks 14th in receiving yards (458) despite ranking just 31st in targets (40).
Longest Active Streak of Consecutive Games w/ 58+ Receiving Yards
— Scott Barrett (@ScottBarrettDFB) December 5, 2022
1. Darius Slayton (6)
2. Davante Adams (5)
3. Amon-Ra St. Brown (4)
4. DeAndre Hopkins (3)
4. D.K. Metcalf (3)
4. Ja'Marr Chase (3) https://t.co/fAkF0eublT
It’s legitimately absurd how inefficient Diontae Johnson has been this season, with a league-worst -6.0 PAR. Hopefully, OC Matt Canada comes to his senses soon and starts forcing the ball more towards rookie George Pickens.
Diontae Johnson ranks 7th in targets (105) and 40th in receiving yards (565)
— Scott Barrett (@ScottBarrettDFB) December 6, 2022
Among all WRs with at least as many targets, this is the 17th-worst season by YPT (5.4) since targets became a stat https://t.co/keuWJXh4ky
Is Detroit the new Coors Field of NFL DFS? Is Jared Goff the Amari Cooper of QBs? This season Goff is averaging 20.9 FPG at home (would rank 7th-best), and 9.3 FPG on the road (would rank 42nd-best). Games taking place at Ford Field have averaged 59.0 combined points per game, reaching 53.0 in 7 of 8 games. For perspective, after Detroit, Seattle leads in combined points per game (51.8). Within this context, perhaps it should come as no surprise Detroit sports the 2nd-highest implied point total of the week (27.75), at home against the 10-2 Vikings.
Amari Cooper [2017-2022]
— Scott Barrett (@ScottBarrettDFB) December 6, 2022
Home: 18.2 DK FPG
Road: 11.3 DK FPG
Diff: +6.9
Amari Cooper [2022]
Home: 22.0 DK FPG
Road: 7.8 DK FPG
Diff: +14.2
Donovan Peoples-Jones [2022]
Home: 6.4 DK FPG
Road: 12.9 DK FPG
Diff: -6.5
(neutral field BUF game excluded for lolz)
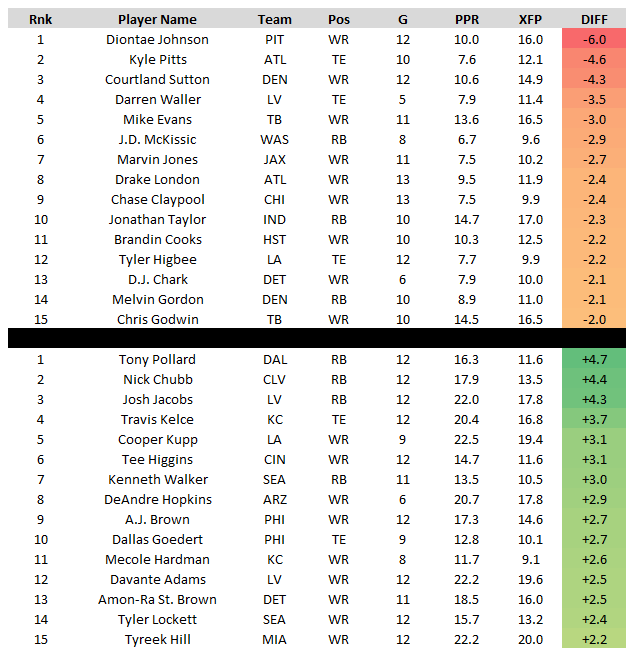
Top Regression Candidates
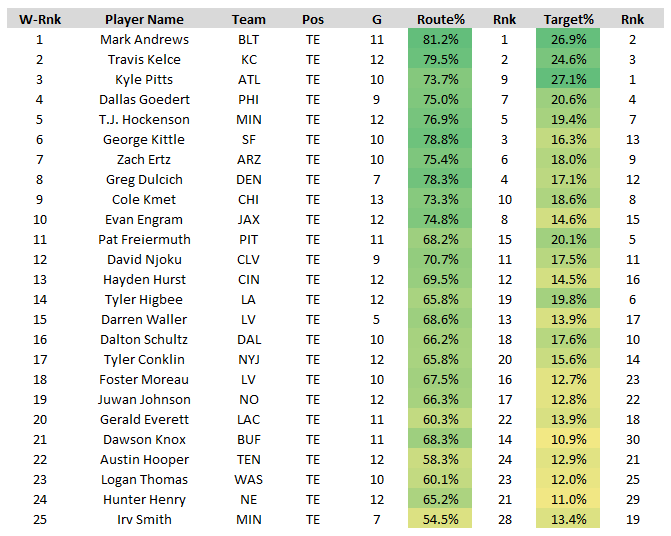
Bell Cow Tight Ends
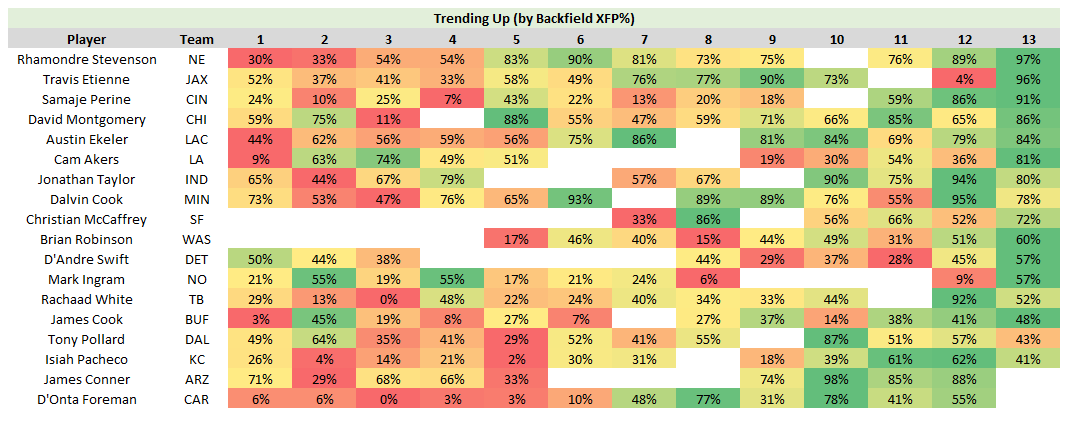
RB Usage Trending Up (Backfield XFP%)
Fantasy Points Negated by Penalty
1. Travis Kelce, TE (17.9)
2. Stefon Diggs, WR (16.7)
3. D.K. Metcalf, WR (16.1)
4. A.J. Brown, WR (15.4)
5. Chris Godwin, WR (14.0)
6. Isaiah Hodgins, WR (13.9)
7. Brandin Cooks, WR (12.1)
8. Amari Cooper, WR (10.4)
9. K.J. Osborn, WR (10.4)
10. Greg Dulcich, TE (10.4)
Backfield XFP% (The Bell Cow Stat)
1. Saquon Barkley, RB (83%)
2. Alvin Kamara, RB (79%)
3. Joe Mixon, RB (75%)
4. Christian McCaffrey, RB (74%)
5. Dalvin Cook, RB (74%)
6. Derrick Henry, RB (73%)
7. Josh Jacobs, RB (73%)
8. Jonathan Taylor, RB (71%)
9. Rhamondre Stevenson, RB (70%)
10. Austin Ekeler, RB (70%)
Team XFP%
1. Derrick Henry, RB (33%)
2. Christian McCaffrey, RB (28%)
3. Saquon Barkley, RB (28%)
4. Tyreek Hill, WR (27%)
5. Cooper Kupp, WR (27%)
6. Rhamondre Stevenson, RB (26%)
7. Davante Adams, WR (26%)
8. Stefon Diggs, WR (26%)
9. Justin Jefferson, WR (26%)
10. Austin Ekeler, RB (26%)
XFP per Team Play
1. Tyreek Hill, WR (0.32)
2. Cooper Kupp, WR (0.31)
3. Stefon Diggs, WR (0.30)
4. Christian McCaffrey, RB (0.30)
5. Davante Adams, WR (0.30)
6. Austin Ekeler, RB (0.30)
7. Justin Jefferson, WR (0.30)
8. Joe Mixon, RB (0.28)
9. Derrick Henry, RB (0.28)
10. Rhamondre Stevenson, RB (0.28)
DFS Values (DK)
1. Zonovan Knight, RB (3.2X)
2. Diontae Johnson, WR (3.1X)
3. Leonard Fournette, RB (2.9X)
4. Evan Engram, TE (2.9X)
5. Courtland Sutton, WR (2.9X)
6. Greg Dulcich, TE (2.8X)
7. Joe Mixon, RB (2.8X)
8. Hayden Hurst, TE (2.8X)
9. Zay Jones, WR (2.7X)
10. Adam Thielen, WR (2.6X)
DFS Values (DK, Last 5 Weeks)
1. Nico Collins, WR (3.5X)
2. Zonovan Knight, RB (3.2X)
3. Cade Otton, TE (3.2X)
4. Stefon Diggs, WR (2.8X)
5. Greg Dulcich, TE (2.8X)
6. Zay Jones, WR (2.8X)
7. Garrett Wilson, WR (2.7X)
8. Rachaad White, RB (2.6X)
9. Courtland Sutton, WR (2.6X)
10. Dalton Schultz, TE (2.6X)


