
Hello, and welcome to the Week 5 XFP Report. If you’re unfamiliar with XFP, I’ll get to that in a little bit.
But basically, every week we’re going to be telling you which players are seeing the best volume for fantasy, as measured by Expected Fantasy Points (XFP). We’ll be telling you who the best buy-low and sell-high candidates are, as measured by Points Above Replacement (PAR), or the differential between actual- and expected fantasy points. This is an especially effective approach in DFS, where players are typically priced by production rather than volume, though PAR will regress to the mean. And (at the end of the article) we’re going to be telling you who the best volume-per-dollar DFS plays are.
What is XFP?
Premium subscribers can access XFP (and other advanced stats like air yards, deep targets, end zone targets) here.
Expected fantasy points (XFP) is flat-out the best and most comprehensive way of measuring a player’s volume. It’s telling you – based on a player’s unique usage – how many fantasy points that player should have scored. It’s telling you how many fantasy points a perfectly league-average RB, WR, or TE would have scored with that same exact volume. It looks at every individual carry by down and distance and distance from the end zone and every individual target by depth of target and distance from the end zone, and then cross-references each carry and target to each carry and target with those specific qualifiers over a multi-year sample to tell you what exactly those carries and targets are worth (historically).
Expected touchdowns (XTD), same thing. RBs score from the one-yard line on 54% of their attempts. RBs score from the 17-yard line only 3.6% of the time. So why ever use “red zone carries,” which treats both carries the same, as a fantasy stat? I have no idea.
Why doesn’t everyone point to XFP in their fantasy research? I have no idea. Once you have XFP and XTD you can contrast that with a player’s actual fantasy points or actual touchdown total to tell you how efficient a player has been (PAR). This is especially useful in highlighting regression candidates, buy-low targets, and mispriced players for DFS.
Through 4 weeks of action, here are the top-25 players in expected fantasy points (XFP) per game:
The Top 25
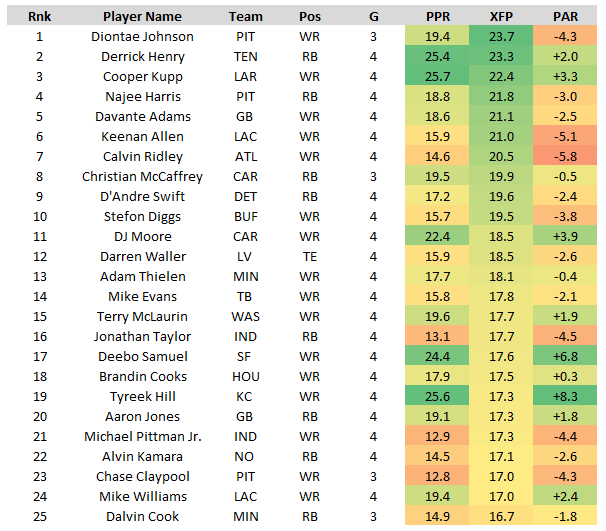
Diontae Johnson, WR, Pittsburgh Steelers
[FPG: 19.4, XFP: 23.7, Diff: -4.3]
Every week Johnson is a mortal lock to: see double-digit targets and smash his DFS salary (3-4X value) and/or spend time in the blue medical tent. And as such, I’m going to continue writing him up for DFS every single week moving forward. Either he hits and I look smart, or he gets hurt and I can blame it all on variance.
In Week 4, his first game back from a knee injury, Johnson led all players at positions in XFP, totaling 30.0 on the back of 15 targets, 144 air yards, 1 deep target, 1 end zone target, and 3 targets inside the 10-yard-line. He now leads all players at all positions in XFP per game (23.7) and XFP market share (32%).
Johnson is the only player to see at least 20.0 XFP in all of his games thus far, and is tied with Cooper Kupp with three such games in totality. He's seen at least 12 targets in 9 of his last 10 games with QB Ben Roethlisberger under center (no injury adjustments). Over this span, Johnson averages 20.9 XFP (33.5% market share), 18.9 FPG, and 12.4 targets per game. For perspective, if over the full season last year, those numbers would have ranked (among WRs): best (best), 4th-best, and best.
Najee Harris, RB, Pittsburgh Steelers
[FPG: 18.8, XFP: 21.8, Diff: -3.0]
There are 40,000,000 fantasy football players in America. The city of Pittsburgh has a population of only 300,000.
Pittsburgh fans may soon start calling for Ben Roethlisberger’s head, but the fantasy community will have his back ride-or-die so long as he keeps getting Harris and Johnson their PPRs.
Harris led all RBs in XFP in Week 3 (37.6) and then ranked 3rd in Week 4 (20.3). He now ranks 2nd in XFP per game (21.8) and 5th in FPG (18.8). He is firmly the “Knickers” of bell cows, leading all RBs in Positional XFP% (97%), Target% (20%), Snap% (92%), and Route% (81%).
Roethlisberger can be as bad as he’s been. The offensive line can be as bad as it's been. And Harris is going to remain no-worse than a mid-range RB1 on this excellent and wholly game script-proof volume.
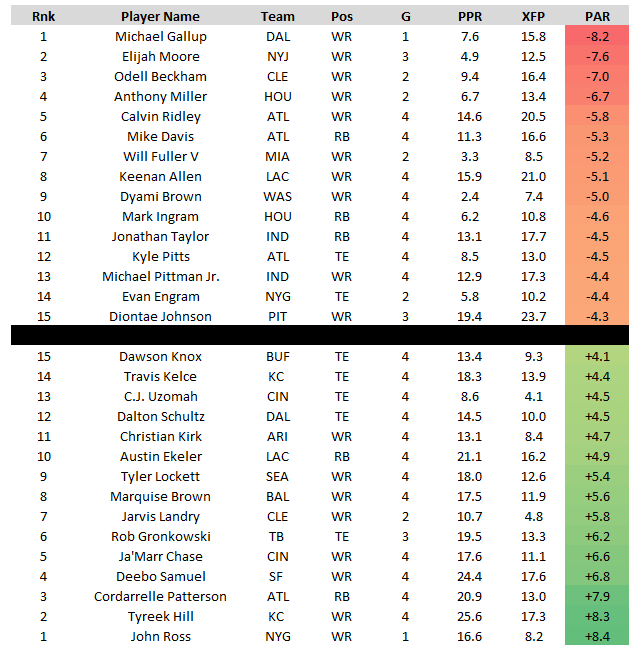
Cordarrelle Patterson vs. Mike Davis
Patterson ranks behind only Tyreek Hill as the most efficient player in fantasy, out-scoring his volume-based expectation by 7.9 FPG. Davis, meanwhile, is the least-efficient RB in fantasy, falling short of his volume-based expectation by 5.3 FPG.
Patterson ranks 2nd among all “running backs” in FPG (20.9), while Davis ranks 33rd (11.3). Davis ranks 9th in XFP per game (16.7), Patterson ranks 21st (13.0).
Patterson has yet to exceed 25 snaps in a single game. He’s played on just 35% of the team’s snaps this season, and, despite scoring 34.6 fantasy points, had a season-low 30% snap share in Week 4. Patterson has yet to exceed 7 carries or 7 targets in a single game, though he’s averaging 6.8 and 5.5 per game. So, how often does a running back inexplicably capped at 25 snaps, 7 carries, and 6 targets per game yield consistent RB2 production (let alone RB1 production)? The answer is: just about never.
As such, my first instinct is to scream “regression to the mean.” And that’s no doubt correct; he’s due for a massive efficiency regression, and that’s coming… But there’s certainly some cause for optimism. In Week 4, Patterson’s volume and snap share remained the same as it did through the first three weeks of the season, but he was used in a completely different way. This time at least he was used more like a true RB/WR hybrid than a pure scatback. (Though, granted, Russell Gage’s absence might have been a key factor.)
In Week 4, Patterson saw his first deep target of the season. He earned a season-high 55 air yards (after averaging -6.7 air yards per game through the first three weeks). And, most importantly, he ran 10 “0-9 routes”, up from just 3 the week prior.
So, if this continues, we really should be viewing Patterson’s 5.5 targets more like 5.5 targets from Laviska Shenault than 5.5 targets from Jeremy McNichols. Further, because Patterson has been so good, and Davis has been so bad, we should be anticipating a larger role moving forward. Right??
Although Patterson’s usage hasn’t dramatically increased over the same span, Davis’ volume has fallen in four straight weeks down from 25.9 in Week 1, to 15.9, to 14.1, to 10.5 last week. And Patterson’s usage has been fine. Since Week 2, he actually ranks 12th in XFP per game (15.3), well ahead of Davis (13.5).
For now, I’m ranking Patterson as a high-end RB2, and I’m moving Davis down to the mid-RB3 range.
Calvin Ridley and Kyle Pitts
Calvin Ridley has fallen 23.4 fantasy points short of his volume-based expectation. This ranks worst among all players at all positions.
Mike Davis has fallen 21.3 fantasy points short of his volume-based expectation. This ranks worst among all RBs.
Kyle Pitts has fallen 17.9 fantasy points short of his volume-based expectation. This ranks worst among all TEs.
Yeah, so minus Cordarrelle Patterson, the Falcons are an absolute mess. The good news is they get another soft matchup this week, against the Jets. And, I think we know who Calvin Ridley and Kyle Pitts are in terms of talent. So, I can’t imagine the (positive) regression doesn’t come soon… And, for what it's worth, Matt Ryan (72.1) surprisingly ranks above Josh Allen in PFF pass grade (70.1). So, at least, he hasn’t been Ben Roethlisberger-levels of bad (53.2).
Among WRs, Ridley ranks 26th in FPG (14.6), but 5th in XFP per game (20.5), 6th in air yards per game (132.5), and 5th in targets per game (11.5). I’d still bet heavily on WR1 production throughout the remainder of the season.
Among TEs, Pitts ranks only 20th in FPG (8.5), but 5th in route share (81%), 5th in XFP per game (13.0), 6th in targets per game (7.0), and 6th in air yards per game (54.0). He’s also the top touchdown-regression candidate at the position; an end zone virgin despite 3 targets inside the 10-yard-line (most) and 4 end zone targets (which ranks behind only Darren Waller). I’d be shocked if he didn’t put up at least low-end TE1 production throughout the remainder of the season.
D’Andre Swift, RB, Detroit Lions
[FPG: 17.2, XFP: 19.6, Diff: -2.4]
Last week, HC Dan Campbell had this to say of Swift: “I, certainly, think you’re going to see a lot more of Swift, and he can very easily be out there first play. I think he’s done enough to earn that.”
Swift, who had been dealing with a lingering groin injury, technically hasn’t started in a single game this season. And up until last week, he was stuck in a near-perfect 60/40 committee backfield alongside Jamaal Williams, earning 59% of the backfield XFP to Williams’ 41%. Nonetheless, despite this handicap, Swift still ranked 3rd in XFP per game (20.2) and 3rd in FPG (20.0).
So, any type of demotion for Williams was going to be massive for Swift. For instance, if the committee moved to 70/30 in Swift’s favor, his 20.2 XFP per game average would have jumped to 23.7, which would have led all players at all positions.
So what happened in Week 4? Did Swift see a massive uptick in usage? Emphatically yes, although it didn’t really result in very many fantasy points (8.9). Swift saw 69% of the backfield XFP, earning 18.0 to Williams’ 8.2. And Swift's snap share jumped from 63% to 72% and his route share jumped from 57% to 73%.
Although Williams out-carried Swift 14 to 8, and they both earned 3 opportunities inside the 10-yard-line, Swift out-targeted Williams 7 to 0. His 18.0 XFP ranked 6th-best on the week, marking the third time this season he’s finished top-6 among all RBs in XFP.
If you drafted Swift, congratulations, he’s a league-winner. If you didn’t, get your exposure via DFS. He’s just the 13th-most expensive RB on DraftKings this week, which feels about 6 spots too low.
Darrell Henderson, RB, Los Angeles Rams
[FPG: 16.6, XFP: 16.1, Diff: +0.5]
If we throw out the fourth quarter of Week 2 to adjust for injury… Henderson is averaging: 15.2 carries, 4.3 targets, 103.6 YFS, 17.6 XFP, and 18.0 fantasy points per four quarters. More impressively, he’s playing on 94% of the team’s snaps while running a route on 81% of the team’s dropbacks. Among all RBs, those numbers rank: 13th, 19th, 4th, 6th, 7th, 2nd, and 1st (tied).
If this sort of usage remains consistent, then we shouldn’t be viewing Henderson too dissimilarly from Najee Harris. They’re both near-every-snap bell cows. And though Harris is better by raw volume (especially in the passing game), at least the overall offensive environment is far better in Los Angeles than Pittsburgh.
But, of course, I’m not sure that this sort of usage remains consistent. Sony Michel fumbled on his third touch of the game last week (occuring in the second quarter), which surely led to an increased role for Henderson. So, maybe he forces an 80/20 or even 60/40 committee at some point in the season. Or, maybe, Michel remains in the doghouse post-fumble. It’s hard to say for sure. But what I do know is, Henderson needs to be viewed as no worse than a fringe-RB1 until that happens.
Brandin Cooks, WR, Houston Texans
[FPG: 17.9, XFP: 17.5, Diff: +0.3]
In a tough matchup against Tre’Davious White’s shadow coverage, Brandin Cooks caught just 5 of 7 targets for 47 yards. This was the first time he fell under 21.0 DK fantasy points since Week 15 of last season.
Still, his volume was a lot better than those 7 targets imply. In a 40-0 beatdown, Cooks’ 7 targets and 47 receiving yards represented a 33% target share and a 54% yardage share.
Only three WRs have commanded at least 25% of their team’s XFP in three games this year: Cooper Kupp (4), Diontae Johnson (3), and Brandin Cooks (3). And he’s the only WR with a yardage share of 33% or better in all four of his games.
Cooks now ranks 13th in XFP per game (17.5), 12th in FPG (17.9), 4th in XFP% (26%), 2nd in target share (34%), and 1st in yardage share (48%).
Other / Quick Hits
Although Cooper Kupp only scored 11.4 fantasy points in Week 4, I’m more encouraged now than ever before. He totaled 28.2 XFP, which ranked 3rd-most on the week. The connection wasn’t quite there this time, but Stafford remained locked onto Kupp, who earned over twice as many targets as the next-closest Rams receiver. He now leads all WRs in FPG (25.7) and ranks behind only Diontae Johnson in XFP Per game (23.2).
Kareem Hunt has seen better volume than Nick Chubb in back-to-back games — two games Cleveland won. Over this span he averages 18.5 XFP per game (RB7) to Chubb's 14.1 (RB19). Chubb has seen 44 carries to Hunt's 25, but Hunt has seen 11 targets to Chubb's 1. Perhaps more alarmingly, Hunt has seen two opportunities inside the 5-yard-line to Chubb's 1. It’s still early yet but I’m worried this backfield will look a lot more like 2019 than 2020 — when Hunt out-scored Chubb in 6 of 8 games both were active.
Last week, with Darius Slayton and Sterling Shepard both out, Kadarius Toney totaled 16.6 XFP (WR21) on a team-high 10 targets. His route share has jumped from 9% to 26% to 74% to 80%. And, most importantly, he looked awesome. Watch this play and then this one. On just 6 receptions he forced 5 missed tackles. Only one other WR has more than 5 missed tackles on the full season (Rondale Moore).
It’s odd to see that our two top touchdown-regression candidates are both on the same team. Jonathan Taylor has scored just once on a league-high 4.8 expected touchdowns. Michael Pittman has zero touchdowns, but totals 2.5 XTD, which ranks 9th-most among WRs… Pitttman ranks 15th among WRs in XFP per game (17.3) but just 40th in FPG (12.9). Averaging 10.7 targets per game over the last three weeks, he’s a strong positive regression candidate, but maybe not this week against a Ravens defense which ranks top-5 against opposing WR1s.
Chase Edmonds ranks 4th among all RBs in YFS per game (98.8). He saw 5 targets and totaled 120 rushing yards (10.0 YPC) last week, while James Conner averaged just 2.8 YPC on 18 attempts (2 targets). And yet, Conner out-scored Edmonds for the second-straight week. Yeah, it’s a major problem that Edmonds isn’t allowed to score touchdowns — Conner and Kyler Murray total 8 carries inside the 5-yard-line vs. Edmonds’ zero.
Titans WR Nick Westbrook-Ikhine ranked 18th in XFP last week, but scored only 5.9 fantasy points on his 17.5-point expectation. And that’s sort of the risk that comes with gambling on min-priced WRs in DFS. The process was good, the volume was good, but the players themselves might not be any good.
Robert Tonyan scored just 2.8 fantasy points last week, but he did see a career-high 7 targets. And, well, lol. But he’s also seen his route share jump every week thus far: 57%, 61%, 71%, 83%.
Dalton Schultz earned 7 targets and eclipsed 17.5 fantasy points for the second week in a row. More importantly, his route share jumped from 60% to 76%, while Blake Jarwin's route share dropped from 57% to 36%. Among TEs, he ranks behind only Travis Kelce in PFF receiving grade (89.3), and he could be an every-week mid-range TE1 (or better) if this sort of usage holds.
Top Regression Candidates
RB Team XFP%
1. Alvin Kamara (29%)
2. Joe Mixon (27%)
3. Derrick Henry (26%)
4. Najee Harris (26%)
5. Christian McCaffrey (25%)
6. David Montgomery (25%)
7. Aaron Jones (23%)
8. D’Andre Swift (22%)
9. Jonathan Taylor (22%)
10. Darrell Henderson (21%)
RB Team Pos XFP% (The Bell Cow Stat)
1. Najee Harris (97%)
2. Darrell Henderson (87%)
3. Saquon Barkley (83%)
4. Joe Mixon (81%)
5. James Robinson (76%)
6. Dalvin Cook (76%)
7. Alvin Kamara (75%)
8. Aaron Jones (72%)
9. Derrick Henry (72%)
10. Josh Jacobs (69%)
WR / TE Team XFP%
1. Diontae Johnson (32%)
2. Cooper Kupp (29%)
3. Davante Adams (28%)
4. Brandin Cooks (26%)
5. D.K. Metcalf (26%)
6. Tee Higgins (25%)
7. Terry McLaurin (25%)
8. Calvin Ridley (24%)
9. D.J. Moore (23%)
10. Deebo Samuel (23%)
11. Keenan Allen (23%)
12. Tyreek Hill (23%)
DFS Values (DK)
1. Diontae Johnson, WR (3.65X)
2. Keenan Allen, WR (3.23X)
3. D’Andre Swift, RB (3.22X)
4. Evan Engram, TE (3.18X)
5. Najee Harris, RB (3.16X)
6. Tee Higgins, WR (3.15X)
7. Zach Ertz, TE (2.98X)
8. Jared Cook, TE (2.97X)
9. Brandin Cooks, WR (2.87X)
10. DeVante Parker, WR (2.82X)
11. Jakobi Meyers, WR (2.76X)
12. Adam Thielen, WR (2.74X)


