
How much does athleticism matter for fantasy football? How important is a player’s height, weight, and BMI? Is it better for a WR to run a fast 40-yard-dash or jump high in the vert? To what degree should a great Combine performance or lackluster Pro Day factor into our evaluation of a rookie prospect?
These are some of the questions I’ve been asking myself the past few weeks.
Earlier this month, I concluded Phase I of my 2021 prospect model, which ranks the top rookie RBs, WRs, and TEs based on their production and efficiency while in college. Specifically, it looks only at the most predictive variables for each specific position – things like age-adjusted yardage share, YPRR, missed tackles forced per rushing attempt, etc. You can read these articles here (for running backs), here (for wide receivers), and here (for tight ends).
Now we’re in Phase II, re-ranking these prospects after adjusting for height, weight, and athleticism. (Phase III marks the completion of our model and ranking process by factoring in draft capital, which is the single-most predictive variable when it comes to evaluating a rookie prospect for fantasy.)
But before we get there, it’s important to know just how much these variables matter.
How much does athleticism matter? (Correlations)
In the first step of my process – in attempting to answer this question – I looked at how each event correlated to best-season fantasy points. I did this for each position, using NFL Combine data (2000-2017) as the basis for our sample.
And, oh boy, were those correlations low.
For running backs:
The most important athletic variable for running backs is Speed Score (or weight-adjusted 40-yard-dash time), but that variable still isn’t very significant overall, with just a 0.12 R-Squared Correlation (RSQ). The next most important variable was 40-yard-dash time (0.07) and then the broad jump (0.04). And the broad jump was actually deemed less significant than a player’s age when coming out (0.06).
Cutting our sample size by weight (big vs. medium vs. small) improved our correlations, but not by much. Speed Score was still the most important event in all three instances, but there were some major differences among our three samples. The 3-Cone was the second most-important event for smaller RBs (0.08), but that mattered very little for big RBs (0.02). The 40-yard-dash was second most-important for big RBs (0.14), followed by the broad jump (0.07). The broad jump was also the second most-important event for medium-sized RBs (0.08).
For tight ends:
Tight end had the highest correlations of the three positions, though the numbers were still fairly low overall. Speed Score was deemed most important at 0.19, followed by the 40-yard-dash (0.17). A TE’s Burst Score (broad jump plus vertical jump) ranked third most-important (0.14), just ahead of the broad jump on its own (0.13), which was then followed by the 3-Cone (0.10).
For wide receivers:
With WRs… Well, WR was a complete mess. The highest correlation is Speed Score (0.06) followed by the 40-yard-dash (0.04), and then the number of reps a WR hit on the bench press (0.03). For perspective, the round a player was drafted in correlated at 0.26 RSQ, and a player’s age was 0.07, higher than for RBs or TEs. And even weight (0.01) and height (0.01) beat out the short shuttle (0.00).
Again splitting our sample by size helped improve our numbers, though our numbers were still quite low overall. Speed Score (0.07), 40-yard-dash time (0.06), and the 3-Cone (0.03) were most important for shorter WRs. Speed Score (0.11), bench press reps (0.07), 40-yard-dash time (0.07), and then the broad jump mattered most for taller WRs (0.05).
Quick Aside (Want to get weird? Let’s get weird.)
If your initial reaction is: “Wow. Athleticism seems massively overrated and nearly totally non-predictive when it comes to evaluating rookie prospects.” Well, then, you’d be right. Or, at least, I had the same reaction.
Something I noticed when running these correlations was that not only were these numbers extremely low – a statistically significant RSQ is somewhere around 0.30, but that’s pretty high for anything prospect-related – but some events actually yielded negative correlations. Intuitively you’d think the more reps a running back gets on the bench press, the stronger and more athletic he is, the better he’d be at football, the better he’d be for fantasy football. And yet, the bench press had a negative correlation for medium-sized RB prospects (-0.01 before squaring). And there were even more examples of such a counter-intuitive finding with the WRs.
To really highlight the absurdity, we’re going to use a cherry-picked sample – all second-round WRs to participate in the Combine from 2000-2017. Within this sample, the three events best at predicting best season PPR fantasy points are:
- the broad jump (0.13)
- the 40-yard-dash (0.07)
- the 3-cone (0.06)
Before squaring, those numbers were:
- the broad jump (-0.35)
- the 40-yard-dash (0.27)
- the 3-cone (0.24)
So, basically, these numbers are saying that the less athletic a WR prospect is, the more fantasy points we should expect them to produce in the NFL. The slower the 40, the shorter the broad jump, the slower the 3-cone, the better the prospect.
If this seems at all counter-intuitive, I’d agree.
Within this sample (all Round 2 WRs from 2000-2017), there were only 7 WRs with a broad jump under 118. They were:
Chad Johnson
Anquan Boldin
Jarvis Landry
Greg Jennings
Robert Woods
Deion Branch
Randall Cobb
On the opposite end of the spectrum, there were 9 WRs with a broad jump over 127:
Jerome Simpson
Justin Hunter
Chris Chambers
Zay Jones
Stephen Hill
Reche Caldwell
Greg Little
Reggie Brown
Mark Bradley
Within our sample, there were 16 WRs to run a 40-time of 4.40 or better. In order, the best players for fantasy were:
DeSean Jackson
Chris Chambers
Eddie Royal
Curtis Samuel
Paul Richardson
Aaron Dobson
Mark Bradley
Roscoe Parrish
Tyrone Calico
The average of all 16 WRs in this sample (by best season PPR fantasy points): 108.4
Meanwhile, the 16 slowest WRs (40-time of 4.56 or worse) within our sample included the following names:
Michael Thomas
Davante Adams
Allen Robinson
Chad Johnson
Anquan Boldin
Jarvis Landry
Antonio Bryant
Tyler Boyd
etc.
The average of all 16 WRs in this sample (by best season PPR fantasy points): 196.2 (81% better than our faster sample).
Okay, so my prior was confirmed — the NFL Combine seems massively overrated for wide receivers. But what exactly is going on here? How is it that the data is this strong and suggesting there's some massive disadvantage for WRs who are fast and explosive?
Well, as usual, I took this question over to fantasy football's preeminent philosopher and logician Adam Harstad. As always, he delivered. Here’s a heavily paraphrased and dumbed-down version of his response:
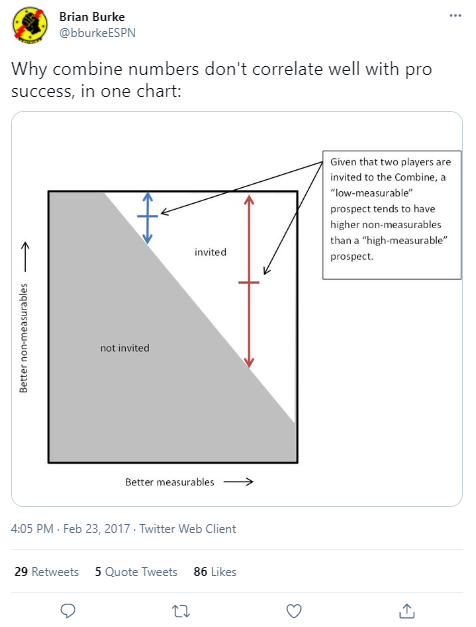
“What you’re looking at here is a very specific type of selection bias (Berkson’s Paradox). Within the sample of ‘all living humans,’ I’m sure 40-yard-dash time has a very high correlation to PPR fantasy points scored. But you’ve instead narrowed your pool on the basis of something that already preselects for some level of desirability. Only the most athletic football-playing humans are invited to the combine, and those who aren’t very athletic (by necessity) are already extremely good at football.
Suppose for simplicity’s sake that WR skill is composed entirely of only two variables – 1) tangible skills / traits (e.g. is big, fast, jumps really high) and 2) intangible skills / traits (e.g. flawless route runner, extreme work ethic). The Combine measures tangibles. Then there’s no correlation between those measured tangibles and NFL production, because, on average, the higher a receiver’s tangibles were the lower his intangibles were. And the lower his intangibles, the higher his tangibles.
And then by focusing solely on Round 2 WRs, you’re naturally weeding out the players with both top-notch tangibles and intangibles, since those players all went in Round 1. So, players with both tangibles and intangibles are drafted early, players with neither tangibles nor intangibles don’t get drafted, and then the middle grounds are all a tradeoff where the more tangibles a guy has the fewer intangibles he has.”
ESPN’s Brian Burke illustrated this point beautifully in 2017:
Though this may be a total fool’s errand, I continued to parse through the data I have in an attempt to answer…
How much does athleticism matter? (Splits)
In our second attempt to find meaning — any meaning whatsoever — in the Combine, I wanted to look at the data in a slightly different way than straight correlations. How athletic is an elite fantasy option compared to an average one? Or an above average fantasy player to a below average one? What happens when we bring draft capital into the equation? What events might NFL teams be overrating or underweighting in the NFL draft?
Notes: An elite RB is defined as one with multiple top-12 seasons by total fantasy points. For WRs, multiple top-15 seasons. For TEs, multiple top-6 seasons… “Best Draft Picks” vs. “Biggest Draft Busts” is measured by whether or not a player beat their expected Approximate Value (AV) as determined by draft capital.
Running Backs
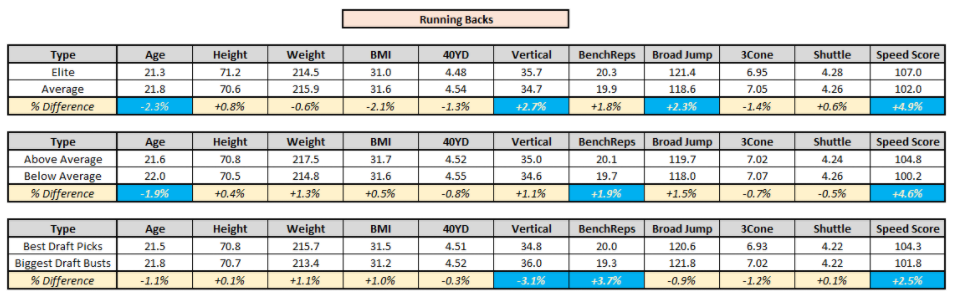
In each grouping, Speed Score appears most significant. But remember, these numbers are still extremely low overall.
Among elite vs. average backs, Speed Score, the Vert, the Broad Jump, and age were most significant.
The data suggests NFL teams are overrating the vert and the bench press for RBs, while underrating Speed Score.
Wide Receivers
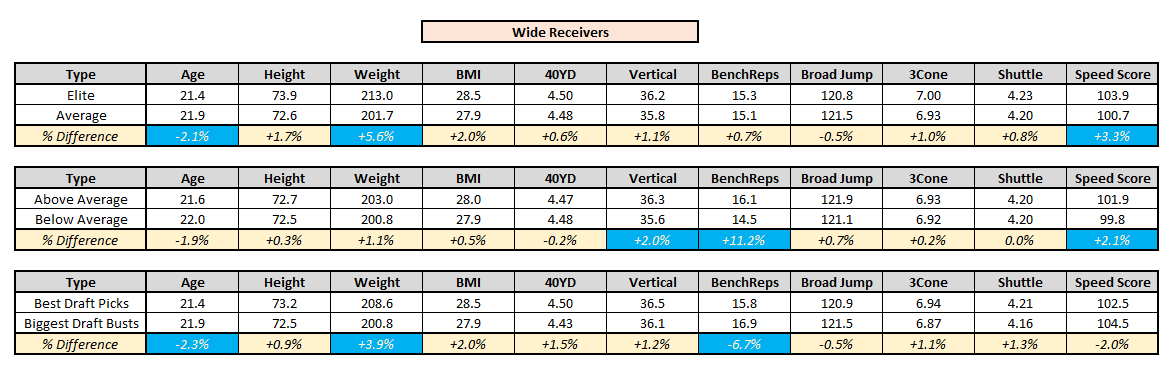
Athletically, there's very little difference between an elite fantasy wide receiver and an average one. And elite fantasy WRs are actually slower and worse at the broad jump than their average counterparts. But weight, then Speed Score, then age seems to matter the most.
Interestingly, bench press was the best event at distinguishing between an above-average and a below-average fantasy wide receiver, but, according to the data, NFL teams still massively overrated that event on draft day. (Or at least, that's what the data implies.)
Again, the data suggests athleticism (or at least how it’s measured at the Combine) matters far less for wide receivers than the other positions.
This was something we hinted at in our last section, and this was also the conclusion drawn by The Harvard Sports Analysis Collective when undergoing a similar study. They write:
“None of the coefficients came out as significant for WRs. In fact, WRs are the only position in which the model can’t significantly predict success. This is somewhat surprising. Maybe route-running abilities really are more important than raw athleticism. Also there are different types of receivers in the NFL ranging from smaller, more agile slot receivers to big, strong possession guys. So maybe there just isn’t a simple linear model that account[s] for this variability in predicting success.”
I think this is correct. Basically, any two Pro-Bowl OTs are probably a lot more similar than any two Pro-Bowl WRs. Slot WR is almost an entirely different position from Outside WR. And then even within those sub-positions, you have a lot of players who profile as very dissimilar (e.g. Cole Beasley vs. Jordan Matthews in the slot, DeSean Jackson vs. DeAndre Hopkins out wide).
Tight Ends
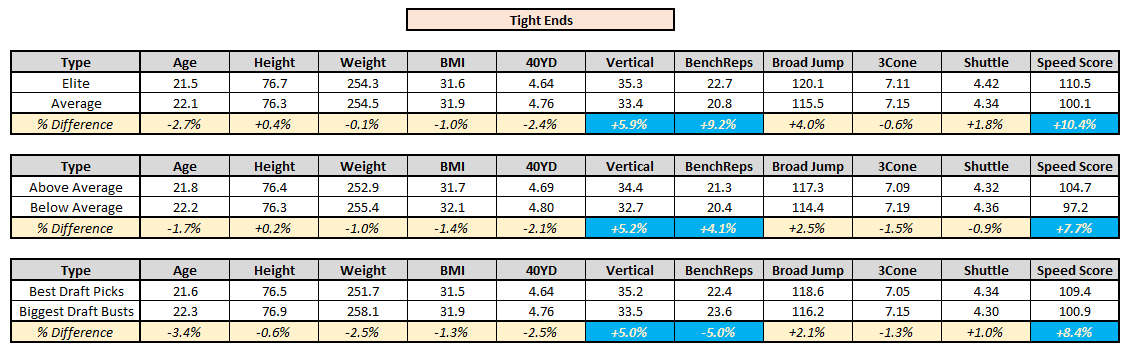
The data seems to imply that the Combine matters most for TEs, then RBs, and then WRs. That's true too for straight correlations. And the single most significant variable across all positions is Speed Score.
But though 10.4% (for Elite vs. Average TEs) is the highest number we've seen so far, it's still quite low.
Speed Score is, at the very least, a positive indicator of talent (and a small one), and not much more than that. Surely no holy grail.
But let’s dig deeper into this stat.
Speed Score
Notes: Speed Score, or weight adjusted 40-yard-dash time, was created by ESPN’s Bill Barnwell in 2008. The formula is (weight in lbs * 200)/(40-time^4).
Here’s the all-time top-20 TE leaders in Speed Score (at the Combine), and their best-season finish in PPR leagues Of these, 50% had at least one TE1 season. 35% had at least one top-5 season.
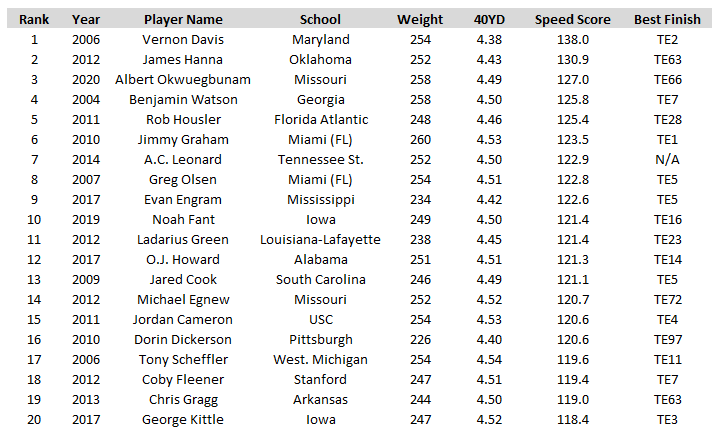
Notes: At his Pro Day in 2021, Kyle Pitts recorded a Speed Score of 130.7, which would rank third-best on this chart. He weighed in at 245 pounds and ran a 4.40 40-yard-dash.
And this hints at one way in which the events appear far more significant.
How much does athleticism matter? (Thresholds)
Your likelihood of posting at least one top-6 fantasy season in your TE career, by Speed Score:
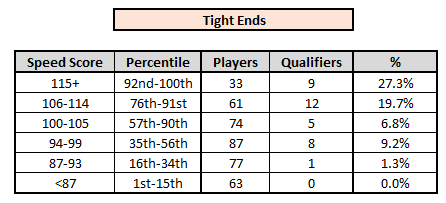
TEs with a double-digit Speed Score had a top-6 fantasy season only 4.0% of the time (9 of 227).
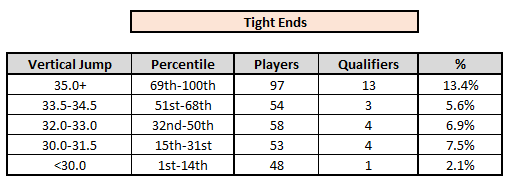
Here's the same thing but looking at the vert for TEs:
And now Speed Score for RBs:
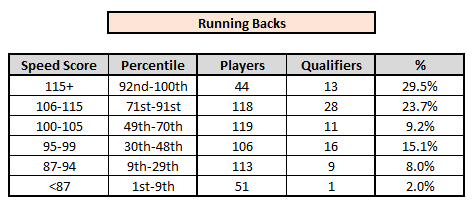
Among all Combine-Invite RBs to post a Speed Score of at least 106.0, 25.3% went on to post at least one RB1 season across their fantasy careers (41 of 162). Among those with a Speed Score below that mark (the bottom ~70%), only 9.5% had at least one fantasy RB1 season.
Introducing A Better Stat (SPORQ)
SPARQ (Speed, Power, Agility, Reaction, and Quickness) score is a fairly popular metric used to measure a player’s athleticism. But it's a pretty flawed stat in the sense that I’m not sure it appropriately weighs each event by its significance or level of importance. And, at the very least, it doesn’t do this on a position by position basis. Intuitively, you’d think the 3-cone should matter more for RBs than OGs, where, probably, the bench press matters a great deal more. And it doesn’t do any of this from a fantasy perspective – Lee Smith has had a hell of a career, but who cares about blocking TEs for fantasy? So that’s what I tried to do here, creating my own stat that only incorporates and appropriately weights the most important athletic events by their actual positional significance from a fantasy perspective.
I’ve been referring to this stat as a player’s SPORQ score — it combines multiple useful things! Hayden Winks (@HaydenWinks) of Underdog Fantasy does something similar and calls his stat Adjusted SPARQ. Kent Lee Platte (@MathBomb) of Pro Football Network has a similar stat he calls Relative Athletic Score (RAS). All three stats I find are preferable to SPARQ.
We’re about 2,300 words in, and maybe the only takeaway you have right now is that tested athleticism is massively overrated. Though that’s still true, athleticism is still not wholly irrelevant. And SPORQ score separates the signal from the noise better than anything else I could come up with.
Here’s the proof.
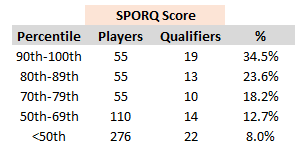
Running Backs
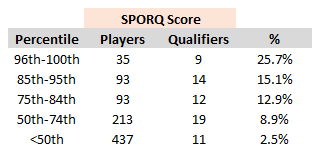
Wide Receivers
Tight Ends
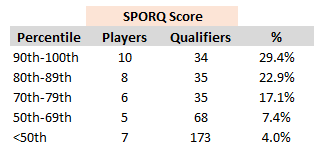
SPORQ score is nearly 2X as predictive as the next-best variable for each of our three positions. And this stat is now available for FantasyPoints subscribers in our Combine Tool, which you can find here.
Check back to the site tomorrow to find my follow-up article, breaking down the 2021 class by SPORQ score, looking at the overall athleticism (compliments and concerns alike) in this class, along with my finalized Pre-Draft rookie rankings.


