
What This Is
- An imperfect analysis of the top 50 veteran running backs’ injury risk and physical performance potential using medical research and injury statistics, written from a rehabilitation specialist’s point of view.
- A highly-individualized analysis for the 2020 season. I reserve the right to scrap and/or alter this season’s process for a more individualized approach in the seasons to come.
What This Isn’t
- An “Injury prediction” article.
- An injury prediction “model.”
- A strict evaluation player’s talent and/or overall fantasy potential.
For rankings and projections, I left it to the professionals here at Fantasy Points. My work merely complements theirs. I also understand fantasy players want some guidance on the chance of injury and volatility of physical health. Enter this pseudo-scientific attempt at quantifying players’ injury risk. Ultimately, the goal is to compile master “volatility” tiers. For now, the focus is on the top 50 veteran running backs going into 2020. The rookie running backs will have a tiers article of their own coming soon.
Methods
As mentioned, injury “prediction” is a fool’s errand, especially in football, as just 2.3% of games are injury-free. However, there are basic orthopedic principles and medical statistics that help to estimate the physical health and performance volatility in NFL running backs:
- The three most common injuries among running backs are to the shoulder, ankle, and hamstring.
- Running routes leads to more concussions than carries do.
- Meniscus surgeries reduce NFL running backs’ games played and snap-share for the first two years after the procedure.
- A history of hand injuries reduces carries and yards per carry among NFL running backs.
- Running backs with 300+ carries tend to play longer in the NFL, suffer fewer concussions, and miss fewer games the following season compared to backs with 150-250 carries in the previous season (this is an entire conversation on its own… click here if you’re curious).
Quantifying Volatility
The volatility scores can be thought of in two branches: physical performance/athleticism and injury risk. The first branch is best quantified by age since there’s a decline in athleticism with time. To reflect this aging process, each player was assigned 0.25 points for every year they were over the age of 24 (24 is the average age of top-12 running backs). Additionally, every running back received a score of 1 for the three most common injuries of the position (ankle/hamstring/shoulder) so the baseline score of every player is 3. To further quantify each players’ risk, recurrence data from the medical research on NFL players was utilized if available (recurrence is defined as the percentage of running backs who sustain an injury more than once in a career). If a recurrence rate wasn’t available in the medical literature, it was calculated manually using the injury reports from 2016-2019. For example, ACL recurrence is 18% and is represented by 0.18 in the volatility score, an ankle sprain recurs at 15% and is represented by 0.15 in the score, etc. To represent the fact that every injury is not created equally, more than one documented concussion in a career is weighed heavier (scored as 1) compared to a recurrent ankle sprain from several seasons ago (scored as 0.15). Lastly, a player had 0.17 points subtracted from their score if they carried the ball 300+ times in 2019, since historical data shows only 49% of these players miss more than one game due to injury in the following season. That’s compared to 66% of running backs with less volume. In other words, an extra 17% of running backs with less volume miss more than one game due to injury. For that reason, their counterparts who saw 300+ carries in 2019 were “rewarded” by subtracting 0.17 from their score.
A full breakdown of assigned units for each injury/performance factor is in the table below.
| Characteristic | Data Type | Value | Assignment Description |
| Hamstring | Medical | 1 | All at baseline |
| Shoulder | Medical | 1 | All at baseline |
| Ankle | Medical | 1 | All at baseline |
| R-Hamstring | Medical | 0.25 | Once per player history |
| R-Shoulder | Medical | 0.1 or 0.26 or 0.5 | AC sprain/surgical dislocation/dislocation |
| R-Ankle | Manual | 0.15 | Once per player history |
| T-Concussion | Manual/Medical | 0.5 | ≥ 40 projected targets |
| R-Concussion | Medical | 0.5 or 1 | More than 2 years ago or within 2 years |
| R-ACL | Medical | 0.18 | Once per player history |
| Knee Surgery | Medical/Subjective | 0.25 and/or 0.5 | Scope and/or Meniscectomy |
| Age | Medical/Manual/Subjective | 0.25 | Once every year ≥ 24 |
| Carries | Medical | -.17 | Once if ≥ 300 carries in 2019 |
| Clinical Judgment | Subjective | Variable | Variable |
| R = Recurrence | |||
| T = Targets |
In situations where data was absent or minimal such as with Chris Carson and James Conner, “clinical judgment” values were assigned to help “balance out” a raw score that might not be a true reflection of their physical volatility. This is similar to the idea of raw projections vs. rankings, but is the most subjective portion of the process.
Raw Results
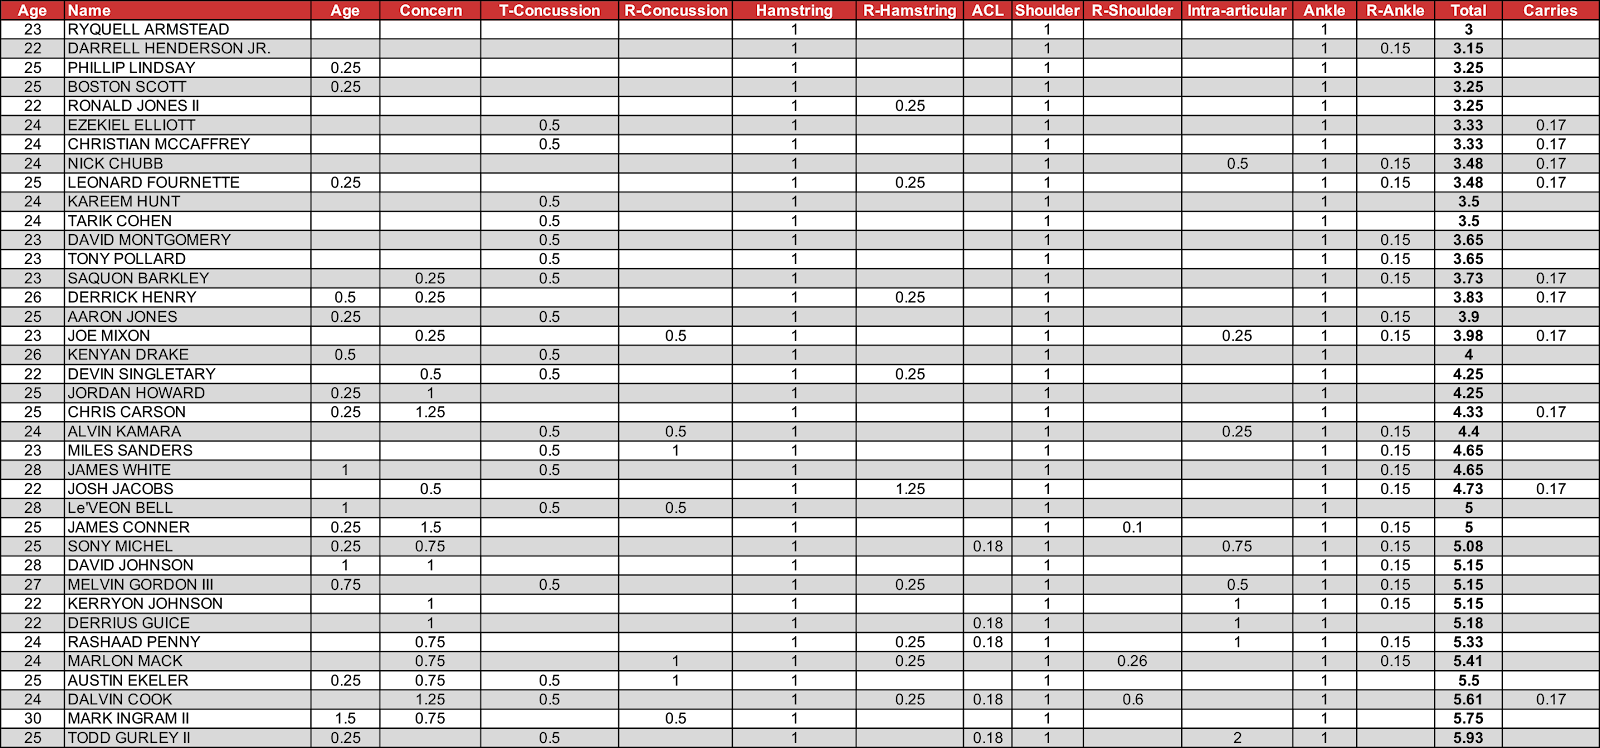
The final score represents each player’s physical volatility score due to previous injury and overall athleticism. Although not perfect, last year players with a high score would have included Todd Gurley and Dalvin Cook. Players with a low score in 2019 would have been Leonard Fournette, Ezekiel Elliot, and Nick Chubb among several others. There were many more players in the “green” tier who did finish 2019 with minimal injury issues, which represents the fact that the previous injury is the most important factor to reasonably project a player’s future health and availability.
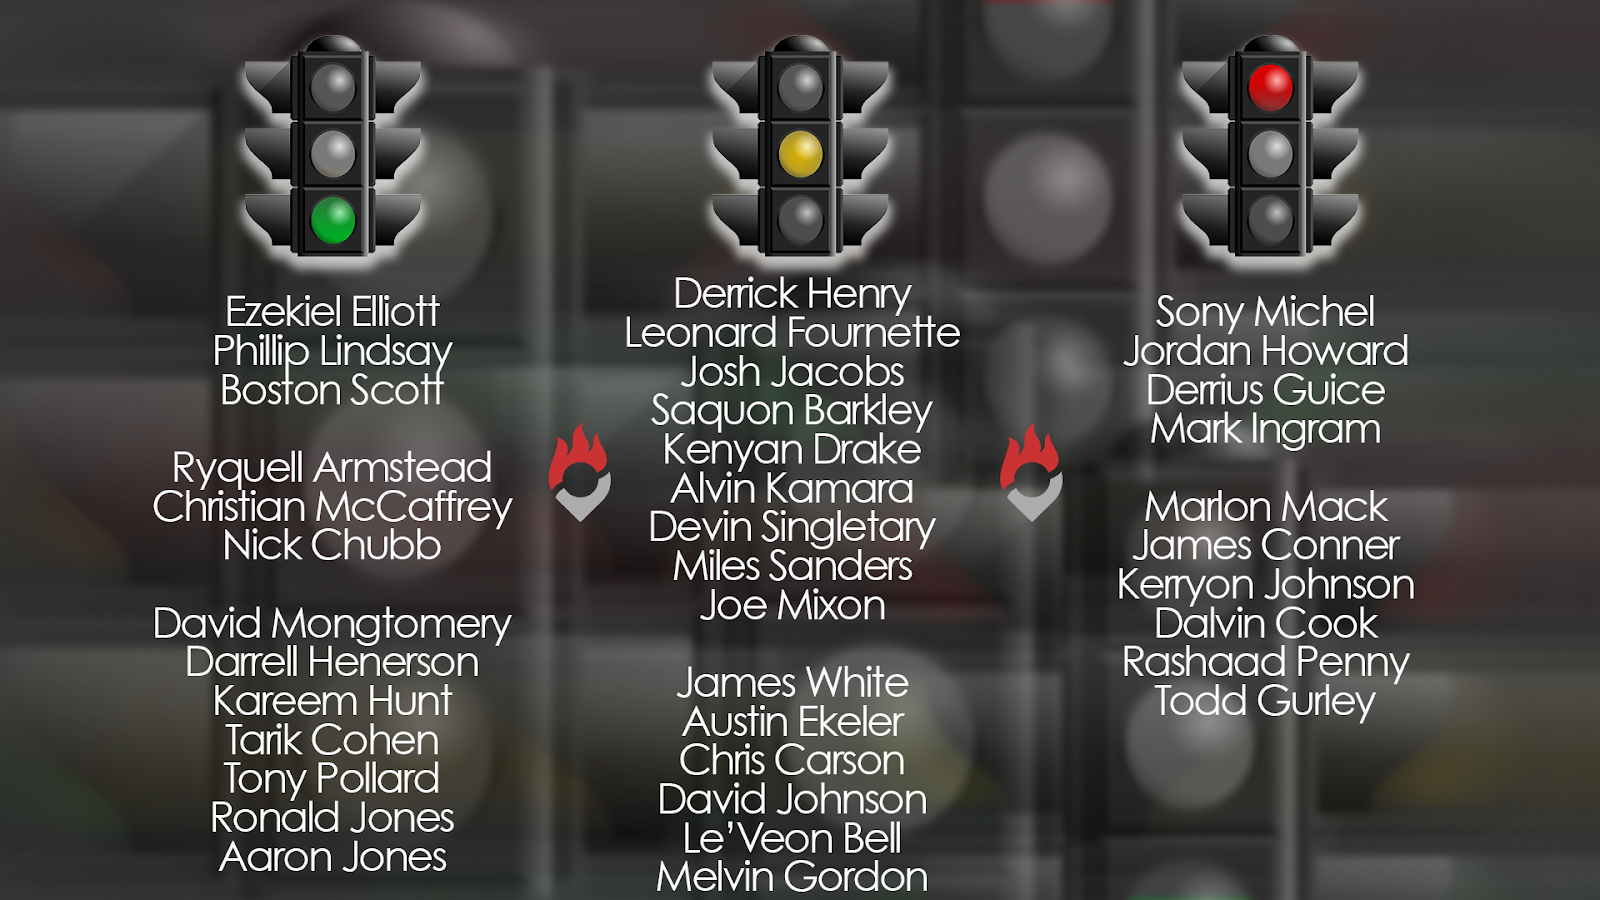
There are obviously several weaknesses to this methodology; but if nothing else, it walks users through how I think of players relative to each other and why. The tiers are split into the traditional “green light,” “yellow light,” and “red light” analogy with a description for each tier.
Results
Green Light Tier
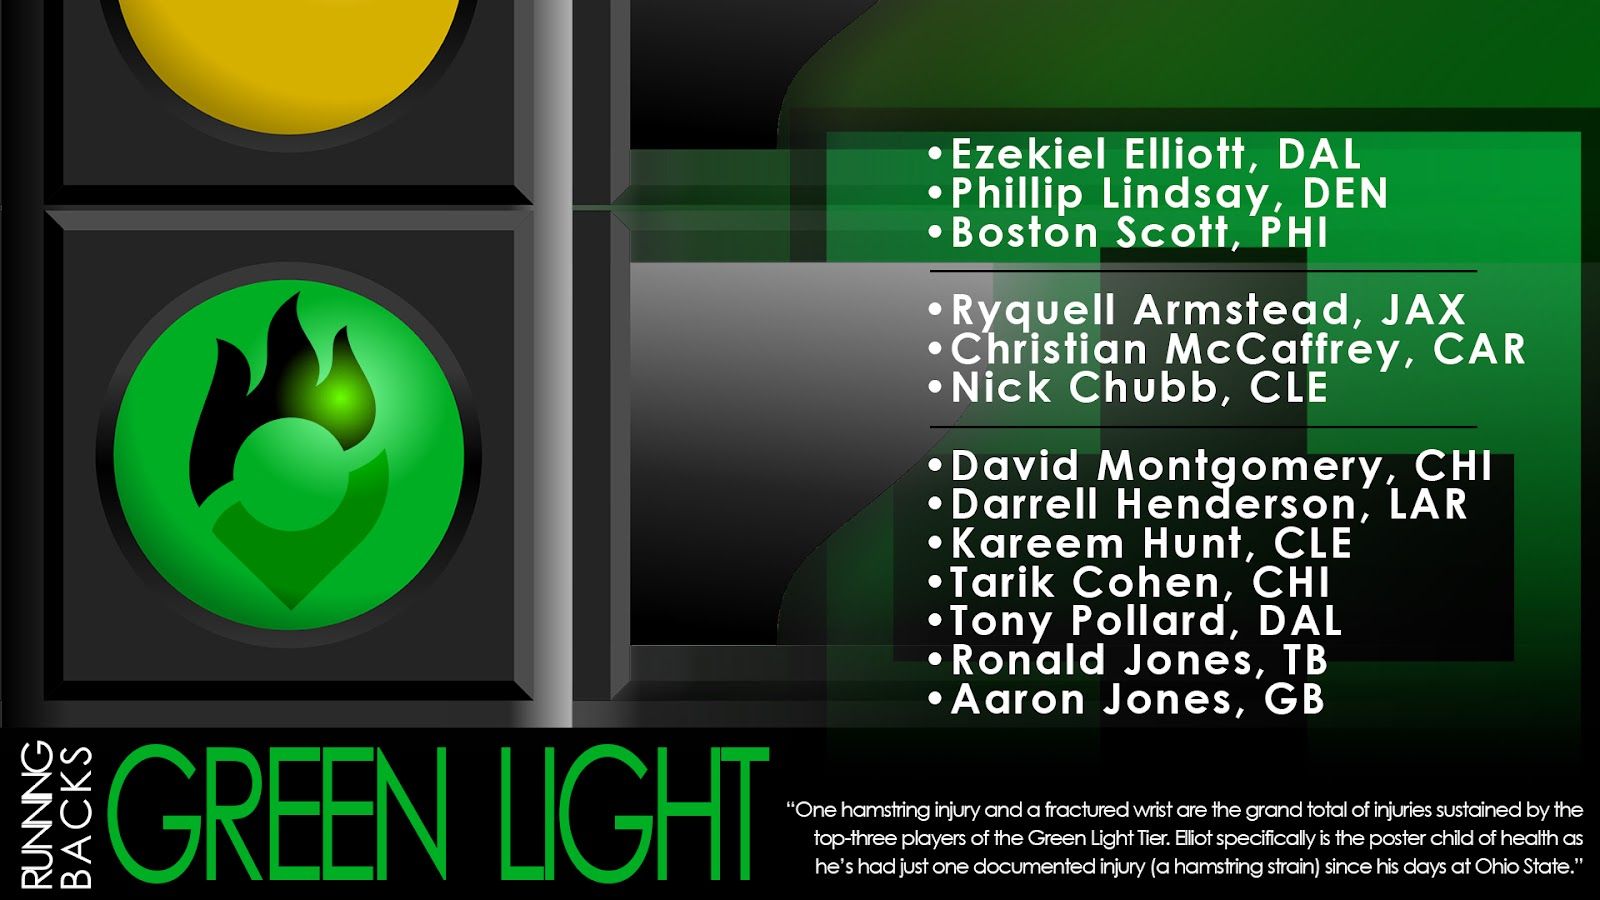
One hamstring injury and a fractured wrist are the grand total of injuries sustained by the top-three players of the Green Light Tier. Elliott, specifically, is the poster child of health as he’s had just one documented injury (a hamstring strain) since his days at Ohio State. Unless catastrophe strikes, he’s what organizations look for in bell-cow backs. McCaffrey and Chubb are also reliable green lights but have had surgical procedures. The rest of the players in the Green Light Tier after Armstead are pass catchers (increased concussion risk), have a limited injury history, or both.
Green Light Tier Takeaway
These guys, especially Zeke, CMC, and Chubb, are elite-level durability warriors. Outside of the usual risk running backs carry, they’re battle-tested.
Yellow Light Tier
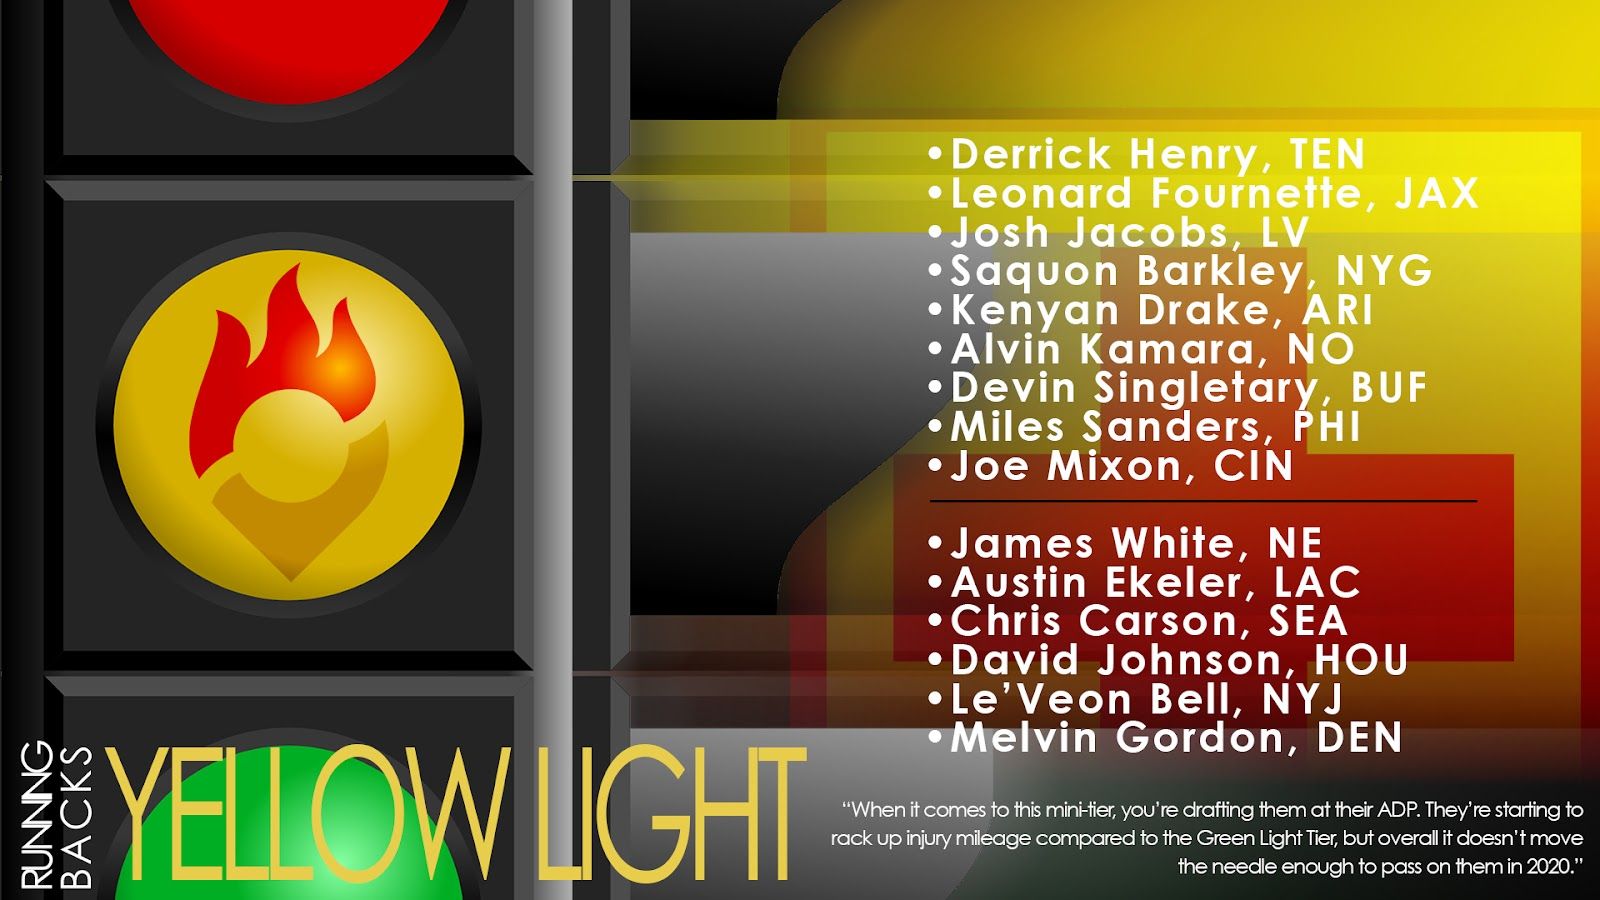
Although the players above are all technically card-carrying members of the Yellow Light Tier, I think of players ranging from Henry to White as a sub-tier… the kind of yellow lights that you’ll beat without an issue, but the car behind you won’t. They are not inherently “at risk” for injury; however, they have not been the picture of health either. For example, Henry has objectively peaked athletically at 26 and sustained a late hamstring injury in 2019. Another notable player in this tier is Joe Mixon, who had a concussion that caused two missed games, and has recurrent ankle sprains following him into last year. Additionally, Alvin Kamara hada “clean up” procedure to his knee, as well as a concussion as a pass-catching back.
Yellow Light Tier 1 Takeaway
When it comes to this mini-tier, you’re drafting them at their ADP. They’re starting to rack up injury mileage compared to the Green Light Tier, but overall it doesn’t move the needle enough to pass on them in 2020.
A break into the second half of this Yellow Light Tier -- a four-way stop if you will -- comes with Austin Ekeler, who has a concussion, a hand injury, and is targeted heavily in the passing game. The medical research shows that all of these characteristics make him, and his fellow tier members, at risk for injury relative to their peers. Chris Carson is in this tier due to the fact that virtually no data exists on return-to-play and/or performance following a femur fracture. Other than that, Gordon rounds out the tier due to his intra-articular (inside the joint) knee surgery from a few years ago and his age.
Yellow Light Tier 2 Takeaway
To summarize, this second Yellow Light mini tier is where the surprises end. If any of these players miss time, “just don’t look right,” or “look like they’ve lost a step” in 2020, a factor to consider is their physical volatility.
Red Light Tier
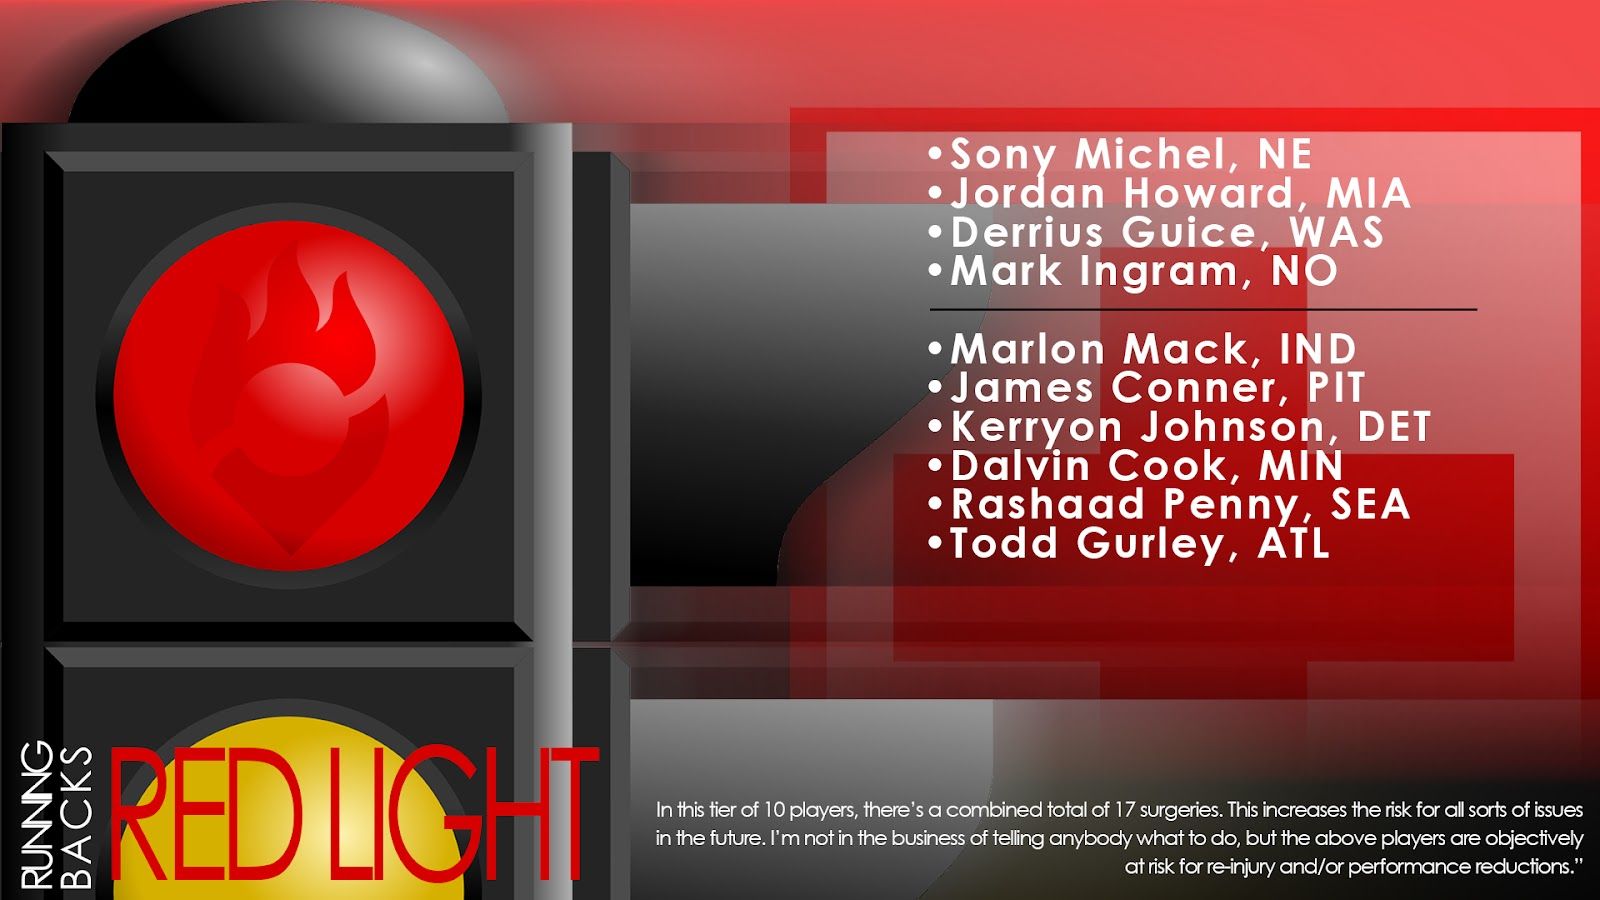
Here we go. The Red Light Tier. This is the “Glass Half…” tier, because when it comes to players like Guice, Cook, and Conner, risk tolerance and your own philosophy will complete the sentence. Most of the fantasy community recognizes these players are a risk, but if a player falls in drafts far enough, overall risk can be mitigated. On one hand, James Conner has never finished a complete season and has finished fewer games every year since entering the league. There’s also an ongoing debate about how cancer treatment may have altered the way his body creates connective tissue. The flip side is that he’s only 25 years old and was pictured looking absolutely jacked just a couple of weeks ago. A similar conundrum applies to Guice, who has played just five of a possible 32 games since entering the league and now has had knee surgeries. One of the surgeries is notorious for setting players back in the season after returning. Kerryon Johnson also underwent this same surgery, has shoulder issues, and now has competition in the backfield. In the case of Ingram, he started to show signs of his body breaking down at age 30 with a calf strain that’s all too close to the Achilles tendon. The only player who has not had surgery in this tier is Jordan Howard, who has a history of “stingers,” which can have a serious underlying cause and simply lead to more missed time.
Red Light Tier Takeaway
In this tier of 10 players, there’s a combined total of 17 surgeries. This increases the risk of all sorts of issues in the future. I’m not in the business of telling anybody what to do, but the above players are objectively at risk for re-injury and/or performance reductions. Obviously it doesn’t mean it will happen, but as I mentioned above, the best predictor of future injury is previous injury.
To wrap, here’s an uninterrupted visualization of the tiers.
Conclusion
In the end, football is a violent sport and any player who steps on the field is at risk for injury. However, after looking at the data and utilizing publicly available information, it’s possible to create a reasonable estimate of each players’ risk. Whether due to injury or physical capabilities, players in the Green Light and Yellow Light tier are associated with much less “risk” when it comes to performance in 2020 compared to the Red Light tier.


