Last season Diontae Johnson had over twice as many receptions as Christian Watson, while also out-gaining him in yards from scrimmage by 216. And yet, Johnson only outscored Watson by a measly 16.6 total fantasy points in half-point PPR scoring. The difference? Touchdowns! Johnson had 0, Watson had 9.
Clearly, touchdowns — worth 60 yards, or 6/12 catches, depending on scoring — are extremely valuable in fantasy football, but touchdowns are also rare events, mostly random, and extremely hard to predict. At each position, touchdowns were far less sticky (showing a much lower correlation year-over-year) than targets, receptions, carries, or yards. We also know that players who ranked highly in touchdowns in one year tend to regress closer to the mean in the following season:
Over the past decade, there have been 167 instances of a FLEX-eligible player recording 10 or more touchdowns in a single season and playing in the following season. Of those, only 18 players (11% of our sample) saw an increase in touchdowns the following season, and, on average, each player lost about 5.2 touchdowns from their prior-season total.
So, we know touchdowns are extremely important for fantasy football but extremely difficult to predict. And because so many people just draft off of last year’s results, we know it’s valuable to pinpoint looming touchdown regression candidates for fantasy. But what’s the best method for evaluating this?
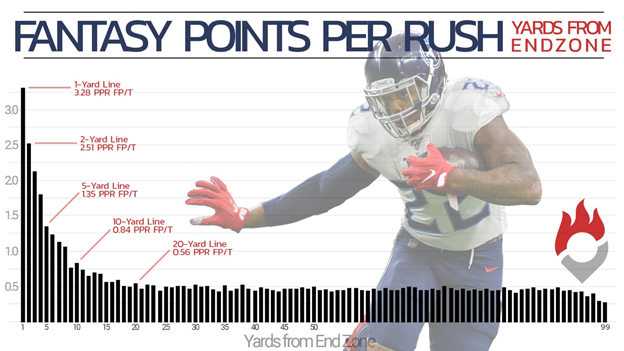
A player’s talent does play a small role in scoring touchdowns, but for the most part, touchdowns are merely a function of a player’s opportunity. The more opportunities you receive — and, specifically, the more opportunities you receive closer to the end zone — the more likely you are to score a high number of touchdowns. And red-zone metrics, though frequently cited, aren’t a very good measure of near-end-zone opportunities, nor are they very good at predicting touchdowns. Why? Because, with red-zone carries, you’re grouping carries from the 1-yard line (53.8% chance of scoring) in with carries from the 17-yard line (3.6% chance of scoring) and treating them the same. A much better stat would weight each carry (and target) at each yard line by the actual degree of scoring probability.
Mike Clay first came up with this idea in 2013, and created a metric called oTD to improve upon red-zone metrics as a predictor for touchdowns. With Clay’s oTD as the inspiration, I attempted to calculate expected touchdowns (XTDs) using a similar methodology. Basically, I’m looking at each carry by distance from the end zone (and weighting each carry according to the average scoring rate on all identical carries over the past decade) and looking at each target by distance from the end zone and depth of target (and weighting each specific target based on the average scoring rate on all identical targets over the past decade). The sum of these numbers gives us a player’s total expected touchdowns, or how many touchdowns we should expect a perfectly average player to score on an identical workload. We can contrast this with a player’s actual touchdown total to measure how lucky or unlucky they were in a given season. And, again, know that I say “unlucky” instead of “inefficient” for a reason, and that’s because…
After testing this, I found this stat — expected touchdowns (XTD) — to be even stronger at predicting touchdowns in the following season as raw touchdowns (0.283 to 0.275 r^2) and far stickier year-over-year (0.382 to 0.276 r^2).
Of the top-25 seasons by (positive) touchdown differential this past decade, only one player scored more touchdowns in the following season, and on average, players saw their touchdown total decline by 52% in the following season. Of the bottom-25 seasons (worst touchdown differential), 18 of 25 improved in the following season, and, on average, by 63%. Clearly, if you were a player at one of the polar extremes in 2022, we should expect a massive touchdown regression in 2022 (hello, Tony Pollard).
Without further ado, by contrasting expected touchdowns with actual touchdowns, here are the players most likely to regress in the touchdown department next season.
Top Regression Candidates
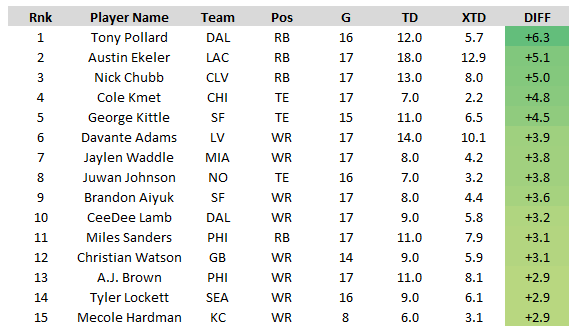
Tony Pollard, RB, Dallas Cowboys
TD: 12.0, XTD: 5.7, DIFF: +6.3
Key Stat: Had Tony Pollard been perfectly average in touchdown efficiency/luck, he would have averaged 2.4 fewer FPG, enough to drop him from RB9 (15.6 FPG) to RB21 (13.2).
Pollard is technically our top regression candidate – he’s almost certain to be less efficient in the touchdown department next season – but that doesn’t mean he’s a bad value at ADP (RB7). Often enough a hyper-efficient season will lead to more volume in the following season. And that certainly appears to be an inevitability this year, with Ezekiel Elliott no longer with the team.
Last season Pollard ranked only 25th in XFP/G (12.0) but finished 9th in FPG (15.6). Elliott played on a higher percentage of snaps than Pollard (55% to 52%) and saw better volume (12.7 XFP/G to 12.0) but Pollard out-scored Elliott by 3.2 FPG (+26%). If Pollard captures just 50% of Elliott’s now vacated XFP, he’d average 18.3 XFP/G (would have ranked 4th-best last year). And if he’s just half as efficient as he was last year by XFP, we should expect 20.1 FPG – which would have ranked behind only Austin Ekeler (22.1) and Christian McCaffrey (20.8).
Austin Ekeler, RB, Los Angeles Chargers
TD: 18.0, XTD: 12.9, DIFF: +5.1
Key Stat: Had Austin Ekeler been perfectly average in touchdown efficiency/luck, he would have averaged 1.8 fewer FPG, closing the gap between him and Christian McCaffrey to only 0.1 FPG.
Last season, Ekeler ranked only 7th in YFS/G (96.3), with only 3.8 more YFS/G than Alvin Kamara (ADP: RB31). But he smashed Kamara and all other RBs in FPG thanks to a position-high 107 catches and a league-leading 18 total touchdowns.
There’s some concern that new OC Kellen Moore will opt for fewer checkdowns and, thus, fewer PPRs for Ekeler. And, of course, if he regresses in the touchdown department that could add up to a disappointing season for a player who cleared 60 rushing yards in only 4 of 17 games last year.
That said, I’m not too worried. Ekeler was our top touchdown regression candidate last year as well, and he’s always been hyper-efficient by XFP. Ekeler’s competition for backfield touches is minimal, and, given that he’s on the last year of his contract, the Chargers are heavily incentivized to give him as much volume as he can handle.
George Kittle, TE, San Francisco 49ers
TD: 11.0, XTD: 6.5, DIFF: +4.5
Key Stat: Had George Kittle been perfectly average in touchdown efficiency/luck, he would have averaged 1.8 fewer FPG, dropping him from TE2 (13.5 FPG) to TE6 (11.7).
Kittle is definitely a player I’m worried about for a number of reasons.
In addition to an almost inevitable touchdown regression, he’s also now dealing with a great deal more target competition. Kittle’s target share dropped from 21.9% in 2021 to 18.7% last year, and in games in which Deebo Samuel and Christian McCaffrey were both healthy, that fell to just 15.6% (would have ranked 15th, just ahead of Tyler Conklin and Hayden Hurst). With all that target competition and on such a run-heavy offense (San Francisco ranked 26th in pass attempts per game last year), Kittle needs to be outlierish-ly hyper-efficient if he’s going to pay off his TE4 ADP. Granted, he’s one of the most efficient TEs of all time. But there are also signs of a decline as he enters his age 30 season – Kittle’s 1.97 YPRR in 2022 was his worst since his rookie year.
Christian Watson, WR, Green Bay Packers
TD: 9.0, XTD: 5.9, DIFF: +3.1
Key Stat: Had Christian Watson been perfectly average in touchdown efficiency/luck, he would have averaged 1.3 fewer FPG, dropping him from WR34 (11.7 FPG) to WR50 (10.4).
Across one 4-week stretch, Watson scored 8 touchdowns on only 17 touches. So, yes, he’s due for a touchdown regression. There’s no doubt about that. But also, his +3.1 differential wasn’t anywhere near as large as I expected. That’s because although Watson didn’t see a lot of volume, the volume he was seeing was highly valuable and more conducive towards scoring touchdowns – among all players with over 60 targets, Watson led in XTD per opportunity (0.08) and ranked top-3 in both deep target rate (31.3%) and percentage of targets coming inside the 10-yard-line (10.4%).
And, more than anything, I think the biggest takeaway is just how ridiculously good Watson was as a rookie. Watson was both historically hyper-efficient last season (see below) and hyper-productive – he ranked best among rookies and 10th among all WRs in FPG from Week 10-on (when he first started to receive full-time usage).
Top rookie WR TD-adjusted* YPRR seasons since 2007:
— Ryan Heath (@QBLRyan) April 3, 2023
1. Odell Beckham Jr. (2014) - 3.26
2. A.J. Brown (2019) - 3.08
3. Ja’Marr Chase (2021) - 2.96
4. Justin Jefferson (2020) - 2.93
5. CHRISTIAN WATSON (2022) - 2.78
*credits an extra 20 yards for every TD
He’s only being drafted as the WR20 in Underdog leagues, which, I think is too low for a player (I once comp’d to Randy Moss) who possesses massive league-winning upside.
Top (Positive) Regression Candidates
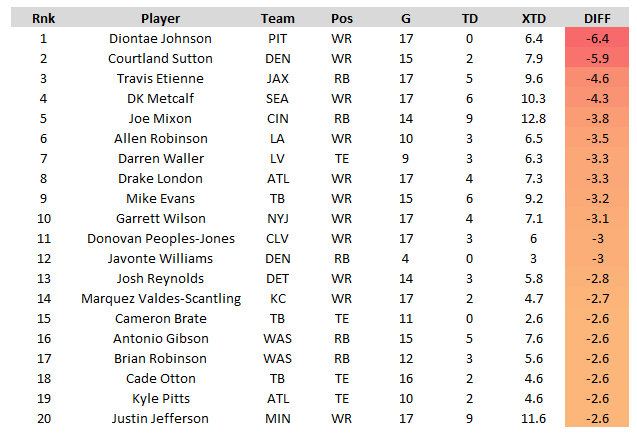
Diontae Johnson, WR, Pittsburgh Steelers
TD: 0.0, XTD: 6.4, Diff: -6.4
Key Stat: Had Diontae Johnson been perfectly average in touchdown efficiency/luck, he would have averaged an additional 2.3 FPG, pushing him up from WR50 by FPG (10.4 FPG) to WR32 (12.7).
Last season Johnson became the first player to fail to score a touchdown despite seeing more than 110 targets (Johnson had 147). He fell 6.4 touchdowns short of his touchdown expectation – the worst mark since Leonard Fournette in 2019. And he wasn’t just inefficient at scoring touchdowns, he was inefficient everywhere. He averaged just 6.0 YPT in 2022 – the 6th-worst mark by any WR with at least 145 targets since targets became a stat in 1992. Thanks to these dreadful efficiency marks, Johnson ranked just 50th in FPG (10.4), despite ranking 13th in XFP/G (15.4). Among all WRs, his -5.0 differential ranked 2nd-worst this past decade, behind only 2020 A.J. Green (5.1).
In other words, he’s now a sort of archetypal mascot of the “targets are earned” movement.
Last season, Johnson ranked 14th in targets per game (8.6). Over the previous two seasons – in healthy games (>50% snap share) – Johnson averaged 10.8 targets per game (most of any WR) and hit double-digit targets 79% of the time (most of any WR). Sure, Johnson was dreadfully inefficient last season (-5.0), but he was only mildly inefficient over the first three seasons of his career (-1.0).
Is Johnson “good”? Should we bet on his volume being sticky, and his efficiency regressing to the mean (or his mean)? Or was Johnson so inefficient that we should expect a massive decrease in volume in 2023?
I’d personally be betting on the former, because I do believe “targets are earned.” That a target, in and of itself, is a positive indicator of talent. That a quarterback throwing a receiver the ball — due to trust, because he’s open, or for whatever reason — is a likely sign that this receiver is good or at least better than his surrounding competition. And Johnson has not only earned targets at an elite rate since entering the league, but he’s also been fairly elite at getting open (which would lend itself towards more targets) – he led the league in ESPN’s Open Rate last year, and has ranked top-4 in every season since he entered the league.
All of this is to say, that yes, I do want to be betting on Johnson at his WR34 ADP. He’s a player who historically draws mid-WR1-levels of volume (he ranks 6th in XFP/G over the last two seasons), and prior to last year, falls only slightly below that in terms of production and efficiency.
But there’s an important caveat here. It’s extremely difficult to separate a WR’s efficiency from that of his supporting cast (QB, play-caller, offensive line, etc.) Maybe Johnson really wasn’t that bad last year, and instead, there were other factors at play holding him back. That said, it’s very hard to feel inspired by Kenny Pickett and Matt Canada. But also, that does feel to be more than priced in.
Courtland Sutton, WR, Denver Broncos
TD: 2.0, XTD: 7.9, Diff: -5.9
Key Stat: Had Courtland Sutton been perfectly average in touchdown efficiency/luck, he would have averaged an additional 2.4 FPG, pushing him up from WR44 by FPG (10.6 FPG) to WR29 (13.0).
Sutton is technically a positive regression candidate, but truthfully I want nothing to do with him at his WR48 ADP. To me, Jerry Jeudy looks like the alpha of this WR group, while Sutton looks like a soy milk-guzzling beta.
Courtland Sutton [2020-2022]
— Scott Barrett (@ScottBarrettDFB) June 10, 2023
w/out Jerry Jeudy: 12.6 FPG (~WR30)
w/ Jerry Jeudy: 6.5 FPG (~WR93)
Current ADP: WR48 pic.twitter.com/Vbax2dcsyx
Travis Etienne, RB, Jacksonville Jaguars
TD: 5.0, XTD: 9.6, Diff: -4.6
Key Stat: Had Travis Etienne been perfectly average in touchdown efficiency/luck, he would have averaged an additional 1.6 FPG, pushing him up from RB24 by FPG (12.3 FPG) to RB16 (14.0).
Like with Sutton, I don’t actually want to be chasing Etienne as a positive regression candidate. Instead, I worry too much that – after Etienne converted just 4 of 40 red zone carries into touchdowns – rookie RB Tank Bigsby was specifically brought in to serve as the team’s primary short yardage and goalline back.
D.K. Metcalf, WR, Seattle Seahawks
TD: 6.0, XTD:10.3, Diff: -4.3
Metcalf is yet another technical positive regression candidate I won’t be targeting at ADP. But if you’re wondering why he’s being drafted three rounds ahead of Tyler Lockett, despite Lockett out-scoring him in back-to-back seasons, this could help explain what’s going on:
If Metcalf and Lockett were both perfectly neutral in touchdown efficiency, Metcalf would have gained 1.5 FPG, and Lockett would have lost 1.1 FPG. That would have been enough to push Metcalf up to WR15 (15.1) and Lockett down to WR21 (14.0). Metcalf’s volume was also significantly better – he ranked 11th in XFP/G (15.8), while Lockett ranked 29th (12.7).
In other words, Metcalf dealt with a great deal of bad luck in 2023, and does appear to be the team’s true WR1. But also, I’d still prefer Lockett to Metcalf at ADP (WR33 vs. WR15).