
Hello, and welcome to the Week 13 XFP Report. If you’re unfamiliar with XFP, I’ll get to that in a little bit.
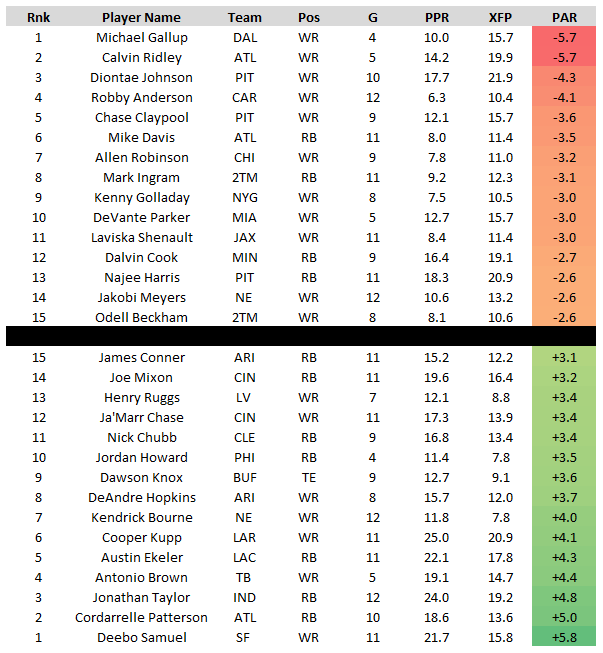
But basically, every week we’re going to be telling you which players are seeing the best volume for fantasy, as measured by Expected Fantasy Points (XFP). We’ll be telling you who the best buy-low and sell-high candidates are, as measured by Points Above Replacement (PAR), or the differential between actual- and expected fantasy points. This is an especially effective approach in DFS, where players are typically priced by production rather than volume, though PAR will regress to the mean. And (at the end of the article) we’re going to be telling you who the best volume-per-dollar DFS plays are.
What is XFP?
Premium subscribers can access XFP (and other advanced stats like air yards, deep targets, end zone targets) here.
Expected fantasy points (XFP) is flat-out the best and most comprehensive way of measuring a player’s volume. It’s telling you – based on a player’s unique usage – how many fantasy points that player should have scored. It’s telling you how many fantasy points a perfectly league-average RB, WR, or TE would have scored with that same exact volume. It looks at every individual carry by down and distance and distance from the end zone and every individual target by depth of target and distance from the end zone, and then cross-references each carry and target to each carry and target with those specific qualifiers over a multi-year sample to tell you what exactly those carries and targets are worth (historically).
Expected touchdowns (XTD), same thing. RBs score from the one-yard line on 54% of their attempts. RBs score from the 17-yard line only 3.6% of the time. So why ever use “red zone carries,” which treats both carries the same, as a fantasy stat? I have no idea.
Why doesn’t everyone point to XFP in their fantasy research? I have no idea. Once you have XFP and XTD you can contrast that with a player’s actual fantasy points or actual touchdown total to tell you how efficient a player has been (PAR). This is especially useful in highlighting regression candidates, buy-low targets, and mispriced players for DFS.
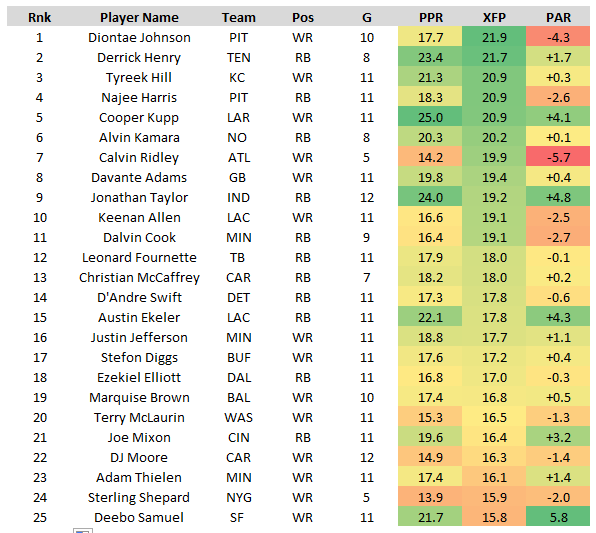
Through 12 weeks of action, here are the top-25 players in expected fantasy points (XFP) per game:
The Top 25
Joe Mixon, RB, Cincinnati Bengals
[FPG: 19.6, XFP: 16.4, Diff: +3.2]
In Week 12, Mixon led all RBs in XFP (29.6) and ranked 2nd in fantasy points scored (32.3). He earned 28 of 37 carries (5 of 5 inside the 10-zone) and 4 of 7 targets out of the backfield.
Mixon now ranks 5th among all RBs in FPG (19.6), and has finished top-4 at the position in 5 of his last 6 games, averaging 24.7 FPG over this span. He’s on quite the hot streak, and he’s undeniably a mid-range RB1 at-worst moving forward (and a possible or probable league-winner down the stretch), but…
His role hasn’t been quite as good as we were promised, which is to say he’s still far more a workhorse than a true bell cow. We were promised an 80% snap share with heavy target volume, but he’s at a 67% snap share and has fewer than 5 receiving yards in 7 of 11 games (63%).
His role really hasn’t changed much at all from 2020, with Samaje Perine serving as the team’s new Giovani Bernard. He’s scoring more fantasy points, yes, but that’s because his gamescript is significantly improved, and the offense as a whole is much more potent (more sustained drives, more scoring opportunities, etc.). Mixon has handled 78% of the team’s carries but just 49% of the targets out of the backfield, which comes out to only 70% of the backfield XFP (9th-most). And, so, with the other RBs siphoning off about 50% of the passing-down work, Mixon is going to continue to be highly-volatile and gamescript dependent on a week-to-week basis.
Now, this doesn’t mean Mixon is due for a massive regression, or that he shouldn’t be viewed as a top-5 RB moving forward. Just that we should expect some volatility week-to-week. Since 2018, Mixon averages 24.4 DK FPG in wins but only 14.4 FPG in losses. And that’s at least a little concerning, because the Bengals face the Ravens (Week 16) and Chiefs (Week 17) in playoff weeks.
But, good news this week! The Bengals are favored to win, albeit just slightly (-3.0), and the on-paper matchup is just about perfect. The Chargers are the league’s top run funnel defense (league-high +5.2% run rate over expectation), ranking 6th-best in passing FPG allowed to QBs (13.9) but 2nd-worst in rushing FPG allowed to RBs (19.8). They also rank 4th-worst in YPC allowed (4.64) and 8th-worst in schedule-adjusted FPG allowed to opposing RBs (+2.6).
Leonard Fournette, RB, Tampa Bay Buccaneers
[FPG: 18.3, XFP: 17.9, Diff: +0.4]
In Week 12, Fournette led all RBs in fantasy points scored (44.1) and XFP (29.6). For perspective, 29.6 XFP ranks as the 6th-best volume any RB has received this season. 44.1 fantasy points ranks 3rd-most.
Bruce Arians told us all offseason he wanted a backfield by committee. But maybe we shouldn’t have believed him.
Fournette was an all-time bell cow in 2019 (17.7 carries and 6.7 targets per game), and he was a bell cow last season when it mattered most for the Buccaneers, averaging 16.0 carries, 5.3 targets, 112.0 YFS, and 21.7 FPG in the postseason. And, well, he’s clearly a bell cow now.
Last week Fournette played on a season-high 81% of the team’s snaps, earning 17 of 24 carries (7 of 8 inside the red zone) and 8 of 8 targets out of the backield. This came one game after Fournette played on 65% of the team’s snaps, earning 11 of 12 carries and 9 of 12 targets out of the backfield. Keep in mind, this was a game Tampa Bay lost 19-29 and trailed throughout.
Fournette is definitely going to continue to be far more productive in wins than losses, but it’s good to know he has some resilience against negative gamescript, thanks to an increase in target volume. (He has seen at least 5 targets in 6 of his last 7 games, and is averaging 7.7 over his last 3 games.)
After Fournette’s monster Week 12, he now ranks 7th in both FPG (18.3) and XFP/G (17.9). Remember, we warned this might happen in Week 6. And, like with Mixon, I see no reason why he can’t be a real league-winner and a top-5 RB down the stretch.
And, at least, he should be viewed as an easy top-5 RB this week. Fournette is basically Jonathan Taylor in wins, averaging 16.0 carries, 4.7 targets, 111.8 YFS, and 23.9 FPG over Tampa Bay's last 6 victories. And, good news! Tampa Bay is favored by 11.0-points, and Atlanta ranks 5th-worst in schedule-adjusted FPG allowed (+3.9) and bottom-10 in both rushing and receiving FPG allowed to opposing RBs.
Jaylen Waddle, WR, Miami Dolphins
[FPG: 15.4, XFP: 14.9, Diff: +0.5]
An update for our Week 12 cover boy, who led all WRs in fantasy points scored (28.7):
This season, Waddle has been the intended target on 25.6% of Tua Tagovailoa’s throws. That ranks well ahead of the next-closest Miami receiver (Mike Gesicki, 15.4%), and would rank 10th among all receivers. Clearly, their rapport has carried over from the Alabama days.
In addition to better target volume with Tagovailoa (25.6% target share vs. 19.1% with Jacoby Brissett), Waddle is also seeing significantly better target quality (8.1 aDOT vs. 5.4).
Waddle now ranks as the overall WR2 since Week 6, averaging 9.6 targets and 18.1 FPG over this span. In Tagovailoa’s 5 full games, Waddle is averaging 9.4 targets and 19.3 FPG. And, without DeVante Parker, that jumps to 10.0 targets and 23.5 FPG in a 4-game sample. So, any way you want to look at it, that’s either WR7-, WR5-, or WR2-levels of production.
It looks likely Miami will be without both Parker and Will Fuller again this week. He’ll get a Giants defense that ranks 5th-worst in schedule-adjusted FPG allowed to opposing WR1s (+2.5). The Giants also sell out to stop the deep ball and funnel their production short and to the intermediate areas of the field (86%, 3rd-most), where Waddle does most of his damage. And they’re also a top-10 slot funnel matchup, ranking 11th-worst in FPG allowed to slot WRs (13.8), but 13th-best against outside WRs (20.1). Waddle has run roughly 50% of his routes from the slot over the last four weeks.
Elijah Mitchell, RB, San Francisco 49ers
[FPG: 14.8, XFP: 12.6, Diff: +2.2]
Mitchell is the perfect example of how median projections are flawed. All season I’ve been viewing him as essentially this: 50% chance he gets 90 rushing yards and nothing else (9.0 fantasy points), 50% chance he scores twice (or once with the 100-yard bonus) and drops ~22.0 DK fantasy points. He averages 16.3 DK FPG this season. But that’s better expressed this way — he averages 23.2 DK FPG in his top-50% of games and 9.4 DK FPG in his bottom-50% of games.
Essentially, he’s great for tournaments, but is exceedingly risky for cash. But, for season-long leagues, if you own Mitchell, you have to be feeling pretty good. Mitchell went undrafted in 99.999% of leagues, but I’m viewing him as a solid low-end RB1 for the remainder of the season.
Mitchell earned a season-high 70% snap share in Week 12. He finished the week 3rd among RBs in both XFP (24.8) and fantasy points scored (28.0). He earned a bell cow-like, 28 of 30 carries and 6 of 8 targets out of the backfield (minus Deebo Samuel).
Mitchell was a bell cow in Week 12, and even in a worst-case scenario is an extremely high-end workhorse. He’s seen at least 27 carries in back-to-back games, and at least 18 carries in 4 of his last 5. And, encouragingly, it seems he’s finally being used in the passing game. He’s seen 5 or more targets in 2 of his last 3 games, though he had just 4 total targets through his first 5 games. (Granted, Jamycal Hasty’s absence last week might have been a factor there.)
In victories, Mitchell is averaging 21.6 carries and 101.4 rushing YPG. And, good news! The 49ers are favored this week, by 3.5-points, against a Seattle defense that ranks 2nd-worst in schedule-adjusted FPG allowed to opposing RBs (+8.4). He’s an easy RB1 this week.
Brandin Cooks, WR, Houston Texans
[FPG: 13.7, XFP: 15.3, Diff: -1.6]
Cooks is again an enticing value on DraftKings, priced as just the WR18 ($5,900). He’s a glaring value based on volume (12th among all active and slate-eligible WRs by XFP/G), but he’s still probably too risky and volatile for cash. The threat of bracket coverage is a serious concern every single week. And he’s incredibly boom-or-bust. But everything (at least on paper) points towards a “boom” performance this week. (Though I’ve said that for three straight weeks now, without much success.)
Cooks is the clear focal point and near entirety of the Texans’ offense, and is seeing terrific volume, but he’s only modestly productive, is woefully inefficient, and highly volatile. He’s hit 17.5 fantasy points in 5 of his 11 games (8th-most), but averages just 8.5 FPG the rest of the time. He ranks 9th in target share (25.6%), 10th in XFP% (22.7%), 15th in targets per game (9.0), 21st in XFP per game (15.9), and 29th in FPG (13.7). So, fringe-WR1 levels of volume, mid-range WR3 production, and bottom-15 levels of inefficiency (-1.6 PAR). I think that seems about right as an every-week expectation moving forward.
However, part of the problem is, Cooks averages just 9.6 FPG over his last 3 games (down from 15.3), and his two worst games by XFP have come over the last two weeks. And, most alarmingly, these were all near-perfect on-paper matchups.
In Week 9, he scored 11.6 fantasy points (on 14 targets) against a Dolphins defense that ranks 3rd-worst in FPG allowed to opposing WRs. In Week 11, after his bye, he scored just 3.8 fantasy points (on 3 targets) against a Titans defense ranking dead-last by the same metric. Last week, he scored 13.5 fantasy points (on 5 targets) against a Jets defense that ranks 2nd-worst in schedule-adjusted FPG allowed to WRs over the last 6 weeks.
So, part of the problem this week — why we can’t just write him off as dead — is that he again draws a near-perfect matchup. He gets a Colts defense that ranks 2nd-worst by schedule-adjusted FPG allowed to opposing WR1s (+4.0). And the Colts also rank 3rd-worst by FPG allowed to outside WRs (24.5). And Cooks caught 9 of 13 targets for 89 yards against them in Week 6. Though they did hold Mike Evans and Chris Godwin to a combined 11.3 fantasy points last week.
So, just know he’s incredibly risky, but he’s a strong high-risk / high-reward GPP-play this week if he goes lower-owned.
Quick Hits
Rob Gronkowski ranks as PFF’s No. 1 receiving TE. He has seen at least one end zone target in all 5 of his 5 healthy grades, and averages 7.8 targets, 75.6 yards, and 18.2 FPG in those games. If over the full season, those numbers would rank 4th, best, and best (by +1.5) among TEs.
Elijah Moore averages 5.7 FPG in Zach Wilson starts, and 20.9 FPG in all other games. I didn't think it was possible for any QB in football to be this much worse than Mike White, Josh Johnson, and Joe Flacco, but alas….
In 4 career starts, Alexander Mattison averages 20.5 carries, 5.0 targets, 124.8 YFS, and 21.2 FPG. Or in his last 3 starts / his 3 starts Minnesota has won, he averages 24.0 carries, 5.3 targets, 156.3 YFS, and 27.0 FPG… Although Mattison was never too involved in games Dalvin Cook was healthy, I do think this is one of those rare instances where the backup (with the starter out) is more valuable than the healthy starter… He should be viewed as a top-5 option this week. The Vikings are favored by 7.0-points against a Lions defense that ranks 3rd-worst in schedule-adjusted FPG allowed (+5.4) and 4th-worst in rushing FPG allowed (16.4) to opposing RBs.
Michael Pittman flopped last week, despite excellent volume. He turned 10 targets and 18.2 XFP (5th-most) into just 9.3 fantasy points (-8.9 PAR). But look for a bounceback performance this week. Pittman runs 80% of his routes out-wide and Houston ranks worst in FPG allowed to opposing outside WRs (25.0). Among all slate-eligible WRs, Pittman ranks 17th in XFP/G (14.7) and 18th in FPG (14.4). And yet he’s just the WR21 by pricing ($5,700). He’s also a phenomenal leverage-play off of Jonathan Taylor, as they’re extremely negatively correlated together (-0.27)…
But that said, Taylor is an unstoppable force of nature and the matchup is even stronger for him than Pittman. Since Week 4, Jonathan Taylor has hit at least 19.0 fantasy points in 9 straight games. Over this span, he averages 28.5 FPG (+5.0 more than next-closest). Since Week 7, he leads all RBs in XFP/G (21.4), though throughout the remainder of his career averaged just 14.4 XFP/G (a 49% increase)… The Colts are favored by 8.5-points and the Texans rank worst in YPC allowed (4.80) and 3rd-worst in rushing FPG allowed (17.5).
Myles Gaskin's backfield XFP% over the last 4 weeks: 91%, 79%, 84%, 60% (Week 12).
After a Week 9 loss against the Ravens, OC Klint Kubiak said Justin Jefferson was “deserving of more targets.” And that’s exactly what we’ve seen play out, as he’s averaging 11.7 targets, 23.3 XFP (low of 21.0), 131.7 receiving yards (low of 83), and 24.1 DK FPG in the 3 games since. For perspective, Jefferson averaged just 15.6 XFP/G through his first 8 games, and 21.0 XFP will typically be good for a top-7 finish in any given week.
Diontae Johnson has hit at least 20.5 XFP in 8 of 10 games this year. He’s seen double-digit targets in 9 of 10 games. And he’s scored at least 15.0 fantasy points in 8 of 10. He hasn’t flashed much of a ceiling (high of 24.2), but he’s easily the most consistent and dependable player in fantasy.
Jakobi Meyers isn’t the top touchdown regression candidate (not even close). It’s Chase Claypool who has fallen 4.7 touchdowns short of his volume-based expectation. Ben Roethlisberger is mostly to blame, I think, as all Pittsburgh players have been woefully inefficient this season. Or maybe, he’s just been hit hard by #theregression, as he was a top (negative) regression candidate last year (+3.5)…. He ranks 17th in XFP/G (15.7), but just 38th in FPG (12.1). If he was perfectly neutral in touchdown efficiency/luck, he’d rank 20th (15.2). If he was as efficient/lucky as Deebo Samuel at scoring touchdowns (+5.7), he’d rank 7th (18.3).
Since Week 2 (and excluding Week 10 due to injury), Cordarrelle Patterson averages 21.6 FPG (low of 14.1) and 15.6 XFP/G. If over the full season, those numbers would rank 4th- and 12th-best among all RBs. Or, 3rd- and 19th-best among all WRs.
The raw volume, and certainly the production, has been somewhat lacking. But David Montgomery is no doubt a high end bell cow. He’s played on at least 80% of his team’s snaps in 5 of his last 5 healthy games, handling 86% of the backfield XFP over this span. For perspective, only Najee Harris has a snap share over 80%, and he’s also the only RB with a backfield XFP% over 80%. Still, he ranks just 27th in XFP/G (12.3) and only 28th in FPG (12.6).
James Conner, however, is an uber-bell cow. Or at least he has been without Chase Edmonds in the lineup. Over his last three games, he averages 18.0 carries, 5.3 targets, 20.7 XFP (RB4), and 25.1 FPG (RB3), while handling 82% of the backfield XFP (RB5).
Since Week 6, Freiermuth ranks 5th in targets per game (6.8), 4th in XFP/G (12.6), and 3rd in FPG (13.6). He’s seen at least 6 targets in 5 of 6 games over this span. He has 5 touchdowns over his last 5 games, and has also hit double-digit fantasy points in 5 of his last 6 games…. Keep in mind, TE Eric Ebron played in 3 of these 6 games, and when he was out, Freiermuth averaged 16.6 FPG, and his route share jumped from 57% to 72%. With Ebron now out for an extended period of time — potentially the remainder of the season — Friermuth needs to be viewed as an every-week mid-range TE1.
If we treat Dontrell Hilliard and Jeremy McNichols as one player… Tennessee’s scatback is averaging 6.7 carries, 8.0 targets, 100.0 YFS, and 17.0 FPG (low of 16.2) over Tennessee's last 3 losses.
Over the last 2 weeks, without Allen Robinson (and mostly without Justin Fields), Darnell Mooney averages 12.0 targets (30%), 18.8 XFP, and 23.3 DK FPG, eclipsing 120 receiving yards in both games. He’s just the WR23 by salary on DraftKings this week ($5,600).
Sterling Shepard ranks 6th among all players in targets per route (0.27). He's hit at least 17.5 fantasy points in 5 of his last 5 healthy games, averaging 23.1 FPG over this span. Over his last 13 games, he averages 8.7 targets and 15.8 FPG. Only Cooper Kupp is averaging over 23.1 FPG, and 15.8 FPG would rank 13th-best among all WRs this season. And yet, Shepard ranks as just the 37th-most expensive WR on DraftKings this week. And if he returns this week (which seems likely), he’ll get a top-3 matchup. Shepard runs 72% of his routes from the slot, and Miami ranks 2nd-worst in FPG allowed to opposing slot WRs (24.0). If he’s back to full health and active, he’s a near lock-button play for me this week, and I think we’ll get him at low ownership.
Update: Welpppp. Daniel Jones has a neck injury and his status for Sunday is in question. If he sits, I’d be far less bullish on Shepard.
Top Regression Candidates
Most Fantasy Points Negated by Penalty
1. Jonathan Taylor, RB (15.1)
2. Najee Harris, RB (14.7)
3. Mark Andrews, TE (14.4)
4. Dallas Goedert, TE (13.6)
5. Josh Jacobs, RB (12.1)
6. Derrick Henry, RB (12.0)
7. Austin Ekeler, RB (11.9)
8. Kenny Stills, WR (11.6)
9. Keenan Allen, WR (11.5)
10. Ezekiel Elliott, RB (10.8)
11. Donald Parham, TE (10.6)
12. Amon-Ra St. Brown, WR (10.5)
RB Team XFP%
1. Alvin Kamara (30%)
2. Derrick Henry (28%)
3. Christian McCaffrey (26%)
4. D’Andre Swift (25%)
5. Najee Harris (25%)
6. Jonathan Taylor (25%)
7. Joe Mixon (24%)
8. Dalvin Cook (23%)
9. Austin Ekeler (21%)
10. Leonard Fournette (20%)
11. Aaron Jones (20%)
12. David Montgomery (20%)
RB Team Pos XFP% (The Bell Cow Stat)
1. Najee Harris (88%)
2. Dalvin Cook (80%)
3. Alvin Kamara (79%)
4. Derrick Henry (78%)
5. Austin Ekeler (76%)
6. Darrell Henderson (75%)
7. David Montgomery (74%)
8. James Robinson (72%)
9. Joe Mixon (70%)
10. Chris Carson (68%)
11. Saquon Barkley (67%)
12. D’Andre Swift (67%)
WR / TE Team XFP%
1. Diontae Johnson, WR (27%)
2. Davante Adams, WR (26%)
3. Cooper Kupp, WR (26%)
4. Tyreek Hill, WR (24%)
5. Calvin Ridley, WR (24%)
6. Deebo Samuel, WR (23%)
7. Tyler Lockett, WR (23%)
8. Keenan Allen, WR (23%)
9. Brandin Cooks, WR (23%)
10. DJ Moore, WR (23%)
11. Justin Jefferson, WR (22%)
12. Terry McLaurin, WR (21%)
DFS Values (DK)
1. DeVante Parker, WR (4.0X)
2. James O’Shaughnessy, TE (3.3X)
3. Sterling Shepard, WR (3.2X)
4. Diontae Johnson, WR (3.2X)
5. Jared Cook, TE (2.8X)
6. Marvin Jones, WR (2.8X)
7. Evan Engram, TE (2.7X)
8. Mike Williams, WR (2.7X)
9. Antonio Brown, WR (2.7X)
10. Najee Harris, RB (2.7X)
11. D’Andre Swift, RB (2.7X)
12. Michael Carter, RB (2.7X)
DFS Values (Last 5 Weeks)
1. Michael Carter, RB (3.4X)
2. Diontae Johnson, WR (3.4X)
3. Marquise Brown, WR (3.3X)
4. Antonio Gibson, RB (3.1X)
5. Cole Kmet, TE (3.1X)
6. Pat Freiermuth, TE (3.1X)
7. Myles Gaskin, RB (3.1X)
8. Van Jefferson, WR (2.9X)
9. DeAndre Carter, WR (2.9X)
10. Mark Andrews, TE (2.8X)
11. Darnell Mooney, WR (2.8X)
12. James Conner, RB (2.8X)


