Other Positions: Quarterbacks Wide Receivers Tight Ends
Never Bury the Lede: The difference between Raheem Mostert’s schedule last year and his schedule this year was the difference between him finishing 29th and 21st in fantasy points per game.
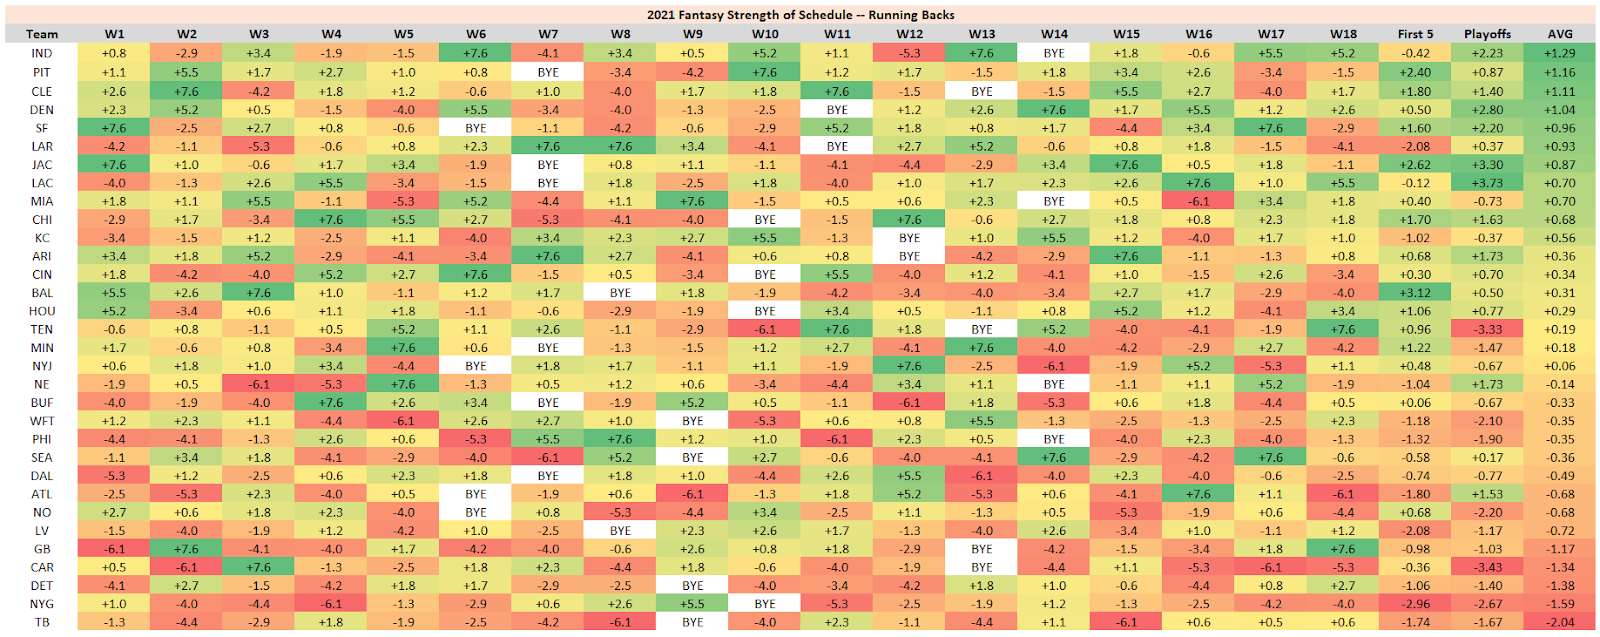
Which running backs have the toughest or easiest fantasy schedules this year? Which running backs had the toughest or easiest schedules last year? Or, what about the toughest or easiest schedules in the fantasy postseason? Or to start the season? Which running backs saw their schedules improve the most or least? How big of an impact was that change in schedule? Can we quantify that change in real terms using fantasy points?
Luckily for our subscribers, we can answer all of these questions and more. But in order to do so, we first had to quantify strength of schedule. This is typically done by calculating a defense’s FPG allowed average, and then looking at the average for all players over a full season. This will also be our approach; however, we’ll be taking things one step further — we’re going to use a control for the opposing offense by measuring FPG over an opponent’s average.
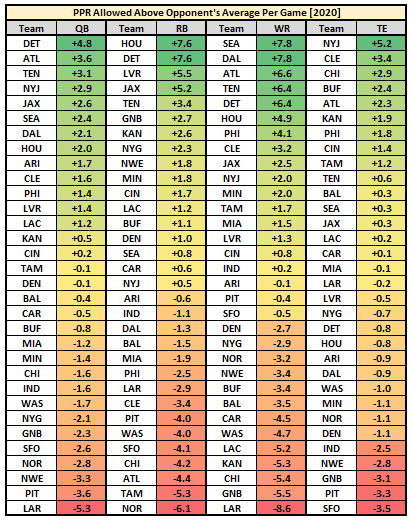
For instance, last season, opposing running backs averaged +7.6 fantasy points per game over their season-long average when facing Houston, which ranked worst in the league. (Houston was the most favorable fantasy matchup for opposing running backs — worth, on average, an additional 7.6 fantasy points per game.) On the opposite end of the spectrum, running backs fell short of their season-long average by 6.1 points when facing the Saints, which ranked best in the league. (The Saints were the toughest fantasy matchup for opposing running backs.) Calculating these numbers for all teams and then applying the full-season average for all players quantifies in real terms which players had the easiest and most difficult schedules for fantasy last year. We can also use these numbers to project out strength of schedule for each team and each position in 2021.
While this methodology isn’t perfect — of course roster turnover and coaching changes will complicate things — strength of schedule doesn’t not matter. This data is still far more actionable than it is not. In fantasy football — like in poker — there may only be small edges to be gained, but those small edges can be compounded to yield a massive advantage. And they must be taken advantage of … and are, by the most dominant players. That’s the case with strength of schedule. It’s another small edge to be realized, and at the polar extremes, it might matter a lot more than you’d expect.
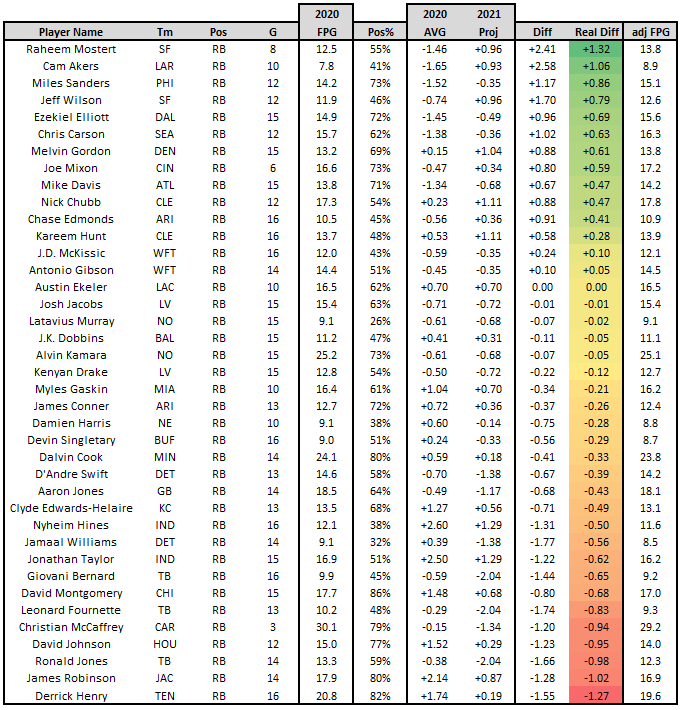
Last season, Raheem Mostert had the fourth-toughest schedule among all fantasy running backs. His average matchup was worth -1.46 [team running back] FPG. Because he was responsible for 55% of the fantasy points generated by San Francisco’s running backs last year (in games played), we can say that — adjusted for strength of schedule, or if he had a perfectly average strength of schedule last year — he would have scored an additional +0.80 fantasy points per game. This would have been the difference between him finishing 29th in fantasy points per game (12.5) and 25th (13.3). Looking forward, Mostert’s schedule is much-improved (most-improved at the position), fairly soft (fifth-softest), and worth an additional +0.52 in real terms (adjusting for usage). Essentially, if he had this schedule last year, he would have scored 13.8 fantasy points per game, which would have ranked 21st-most.
Clearly, strength of schedule – something totally outside of a player’s control and entirely due to luck – can have a big impact for fantasy.
Best Overall Schedule (2020)
1. Nyheim Hines, Average Matchup: +2.60
2. Jonathan Taylor (+2.50)
3. Duke Johnson (+2.15)
4. James Robinson (+2.14)
5. Derrick Henry (+1.74)
Worst Overall Schedule (2020)
1. Saquon Barkley (-4.29)
2. Cam Akers (-1.65)
3. Miles Sanders (-1.52)
4. Raheem Mostert (-1.46)
5. Ezekiel Elliott (-1.45)
2021 Schedule
PDF Download available here.
CSV Download available here.
Best Overall Schedule (Weeks 1-17)
1. Jonathan Taylor/Nyheim Hines (+1.29)
2. Najee Harris (+1.16)
3. Nick Chubb/Kareem Hunt (+1.11)
4. Melvin Gordon/Javonte Williams (+1.04)
5. San Francisco RBs (+0.96)
Worst Overall Schedule (Weeks 1-17)
1. Buccaneers RBs (-2.04)
2. Saquon Barkley (-1.59)
3. D’Andre Swift (-1.38)
4. Christian McCaffrey (-1.34)
5. Aaron Jones/A.J. Dillon (-1.17)
Off to a Hot Start (First Five Weeks)
1. J.K. Dobbins/Gus Edwards (+3.12)
2. James Robinson/Travis Etienne (+2.62)
3. Najee Harris (+2.40)
4. Nick Chubb/Kareem Hunt (+1.80)
5. David Montgomery/Tarik Cohen (+1.70)
Slow Starters (First Five Weeks)
1. Saquon Barkley (-2.96)
2. Josh Jacobs/Kenyan Drake (-2.08)
2. Cam Akers (-2.08)
4. Mike Davis (-1.80)
5. Tampa Bay RBs (-1.74)
Best Playoff Schedule (Weeks 15-17)
1. Austin Ekeler (+3.73)
2. James Robinson/Travis Etienne (+3.30)
3. Melvin Gordon/Javonte Williams (+2.80)
4. Jonathan Taylor/Nyheim Hines (+2.23)
5. San Francisco RBs (+2.20)
Worst Playoff Schedule (Weeks 15-17)
1. Christian McCaffrey (-3.43)
2. Derrick Henry (-3.33)
3. Saquon Barkley (-2.67)
4. Alvin Kamara/Latavius Murray (-2.20)
5. Antonio Gibson/J.D. McKissic (-2.10)
Schedule Change (In Real Points)
Most Improved Schedule
1. Raheem Mostert (+1.32)
2. Cam Akers (+1.06)
3. Miles Sanders (+0.86)
4. Ezekiel Elliott (+0.69)
5. Chris Carson (+0.63)
Least Improved Schedule
1. Derrick Henry (-1.27)
2. James Robinson (-1.02)
3. Ronald Jones (-0.98)
4. David Johnson (-0.95)
5. Christian McCaffrey (-0.94)
Thoughts/Notes/Dank Stats
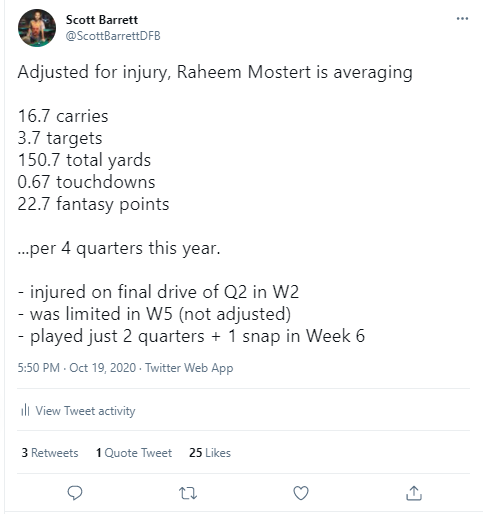
- No running back will benefit more from an improved schedule than Raheem Mostert. (Explained in more detail in the introduction.) San Francisco’s RB room is crowded and Kyle Shanahan RBs are hard to trust, so he’s not necessarily a major target for me in drafts, but he is at least somewhat interesting in best ball leagues (ADP: RB31). Remarkably, Mostert ranks second-best all-time in career YPC average (5.64), in between Hall-of-Famer Marion Motley and all-time legend Bo Jackson. Including the postseason, Mostert averaged 20.0 FPG over his final 8 games in 2019. In 2020, before his first of two I.R. designations of the season, Mostert was averaging 22.7 fantasy points per four quarters.
- Miles Sanders had the league’s toughest schedule last season (-1.52) and has the second-most improved schedule this year (+0.86). That’s one reason to like him. Another is that he was a major bell cow last year despite only middling returns for fantasy, playing on 72% of the team’s snaps in games active (5th-most). Obviously, if new HC Nick Sirianni really does see Round 5 pick Kenny Gainwell as his new Nyheim Hines that would be a concern but I’d be willing to bet against it at current ADP (RB18).
- Cam Akers had the league's second-toughest schedule last season (-1.65) but has the sixth-easiest schedule this season (+0.93). That’s an encouraging sign for one of my favorite draft targets … Akers was also one of my must-draft targets last season too. And it was quite the roller-coaster ride. He earned 15 touches and the start in Week 1. Things were looking good. He earned the start again in Week 2, but suffered a serious multi-week rib injury immediately after seeing the first three RB touches of the game. He struggled to see the field after that, but burst back onto our radar in Week 12, turning just 9 carries into 84 yards and a score. From Week 13 on (including the postseason), Akers handled 72% of the team’s snaps, 86% of the backfield carries, and 58% of the targets out of the backfield. Over this span, he averaged 22.0 carries, 2.3 targets, 118.0 YFS, and 16.6 FPG. All of this culminated in a Todd Gurley-esque workload in the Divisional Round of the playoffs, playing on 48 of 50 snaps. He’s gotten a lot more expensive (ADP: RB11) but that’s also a price I’m more than willing to pay.
- Christian McCaffrey (-3.43), Derrick Henry (-3.33), Saquon Barkley (-2.67), and Alvin Kamara (-2.20) have far-and-away the four-toughest playoff schedules of any RB. That sucks, I guess, but it shouldn’t impact their rankings in the slightest.
- Saquon Barkley easily has the league’s toughest schedule to start the season (-2.96), making him an ideal trade target if he struggles out of the gates.
- Christian McCaffrey has the position's fourth-toughest schedule this year (-1.34), but that means little for the most matchup-proof player in fantasy. McCaffrey had the league's second-toughest RB schedule in 2019 when he scored the second-most fantasy points by any RB ever.
- Good news for the rookies! Najee Harris has the second-softest overall schedule this season (+1.16), and Javonte Williams' schedule ranks fourth-softest (+1.04). Travis Etienne's playoff schedule ranks second-softest (+3.30), while Williams' playoff schedule ranks third-softest (+2.80).
- Could the already run-heavy Browns lean even more run-heavy this year? It’s certainly a possibility. Cleveland has the third-softest RB schedule (+1.11) but the 8th-toughest QB schedule (-0.31). On the opposite end of the spectrum, the Saints have the seventh-toughest RB schedule (-0.68) but the 10th-softest QB schedule (+0.18).
- Since entering the league, Ezekiel Elliott has finished third (21.7), third (20.3), sixth (21.9), fifth (19.5), and last year 16th (14.9) in FPG. What went wrong? Well, a lot. Tony Pollard ate a bit more into Elliott’s workload, as his snap share dropped from 84% in 2019 to 72% in 2020. He was also less efficient, hitting career lows in yards after contact per attempt (2.82) and missed tackles forced per touch (0.18). The overall state of the offense was probably the biggest factor — Dallas ranked dead last in yards per play (4.74) following Dak Prescott’s Week 5 injury, but that also didn’t seem to slow down Pollard at all (3.59, 0.25). Strength of schedule might have also played a role; Elliott had the league's fifth-toughest schedule last season (-1.45). Lucky for him, the offense should be fully back and roaring with Prescott healthy, and Elliott’s schedule ranks fifth most-improved (+0.69).
- David Montgomery averaged 25.7 FPG over his final six games of the year, but just 12.5 FPG up that point (Week 12). What caused this? There were a number of factors at play here. Tarik Cohen suffered a season-ending injury in Week 3, and Montgomery’s snap share jumped from 52% to 80% following his injury. Former All-Pro Cody Whitehair moved from C to LG in Week 12. Matt Nagy handed off play-calling duties to Bill Lazor in Week 10. (For posterity, Nagy has told reporters he will resume play-calling duties in 2021.) Another factor is just random variance — in other words, “splits happen.” But, I think, the most significant factor is strength of schedule. Montgomery had a difficult schedule to start the season (-0.44), but the league's softest schedule from Week 12 on (+4.35).
- We notice a similar trend with Jonathan Taylor. Taylor averaged 25.7 FPG over his final six games of the season, but only 12.5 FPG to start the year. His schedule, already soft to start the year (+1.46) was second-softest of any RB over this latter stretch (+4.07). Luckily for him, he has the softest overall schedule this year (+1.29).
- Derrick Henry was one of the most matchup-sensitive RBs for fantasy last season (+/-7.1), averaging 23.5 FPG in matchups ranking better than average (10 such games) and only 16.4 FPG in matchups ranking tougher than average (6 such games). As you should already know, I heavily prioritize bell cow RBs in start/sit leagues. Because Henry isn’t at all involved in the passing game, he’s going to be more gamescript-sensitive and matchup-sensitive than one of the bell cows. He’s certainly still deserving of a Round 1 draft pick, but I suspect the bulk of my Henry exposure will come in best ball leagues and in DFS (targeting him heavily when favored and in positive matchups).
- For whatever reason, Dalvin Cook was similarly matchup-sensitive last year. Against defenses ranking bottom-6 in schedule-adjusted FPG, Cook averaged 31.3 FPG. In all other games he averaged 18.8 FPG.
- Joe Mixon averaged just 11.5 FPG last year when excluding the 42.1 fantasy points he scored against the Jaguars, who ranked fourth-worst against RBs last season (+5.2). Still, I’m not reading too much into that. He remains a top draft target, poised for a massive bell cow workload (one he’s long deserved) following the departure of Giovani Bernard.


